Robert B. West, Brian P. Rubin, Melinda A. Miller, Subbaya Subramanian, Gulsah Kaygusuz, Kelli Montgomery, Shirley Zhu, Robert J. Marinelli, Alessandro De Luca, Erin Downs-Kelly, John R. Goldblum, Christopher L. Corless, Patrick O. Brown, C. Blake Gilks, Torsten O. Nielsen, David Huntsman, Matt van de Rijn
| Home |
|
Home |
| Figures |
|
Figures and Tables |
| Images |
|
View the CSF1 tissue array images |
| Data |
|
View the CSF1 data |
| Methods |
|
Supplementary materials and methods |
| WebPortal |
|
Stanford Tissue Microarray Consortium Web Portal |
| Authors |
|
Authors |
| Figures | |||||||||||||||||||||||||||||||||||||||||||||||||||||||||||||||||||||||||||||||||||||||||||||
|
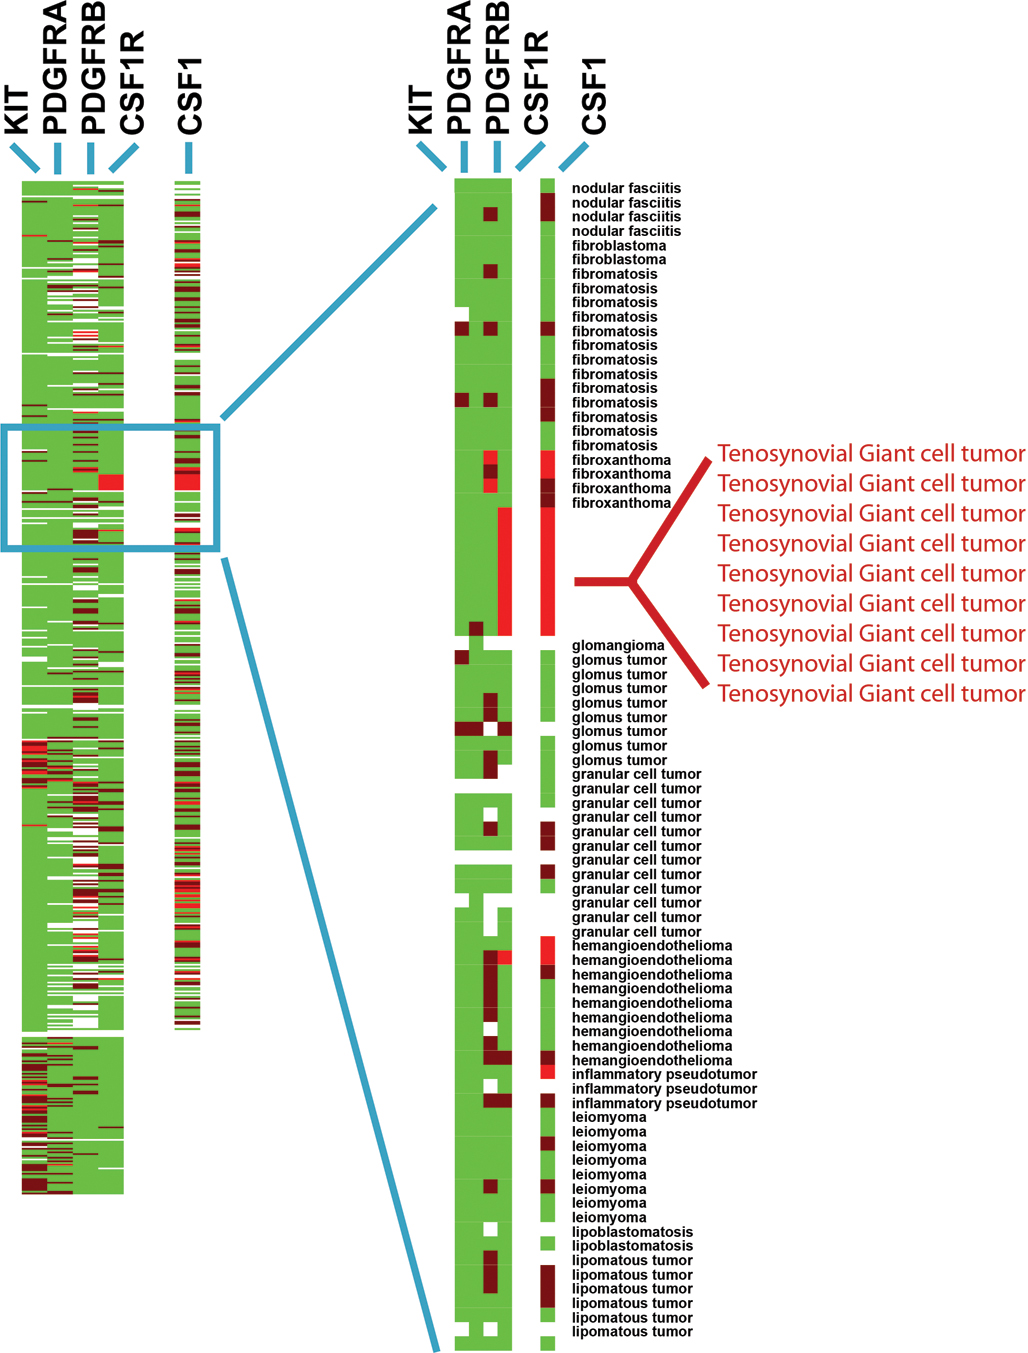
Figure 1: Receptor tyrosine kinase (RTK) expression in 507 soft tissue tumors. Tumors are grouped along the Y-axis by diagnosis. Results of in situ hybridization using four RTK antisense probes: CSF1R, KIT, PDGFRA, and PDGFRB, and one ligand: CSF1, are shown on the X-axis. Bright red = strong expression, dark red = weak expression, green = no expression, and white = no data as a result of tissue loss. The detailed figure with digital images of all stains on all tumors in searchable format is supplied as Supplemental Figure 5 below. | |||||||||||||||||||||||||||||||||||||||||||||||||||||||||||||||||||||||||||||||||||||||||||||
| Figure 1 available as a JPEG file | ||||||||||||||||||||||||||||||||||||||||||||||||||||||||||||||||||||||||||||||||||||||||||||
|
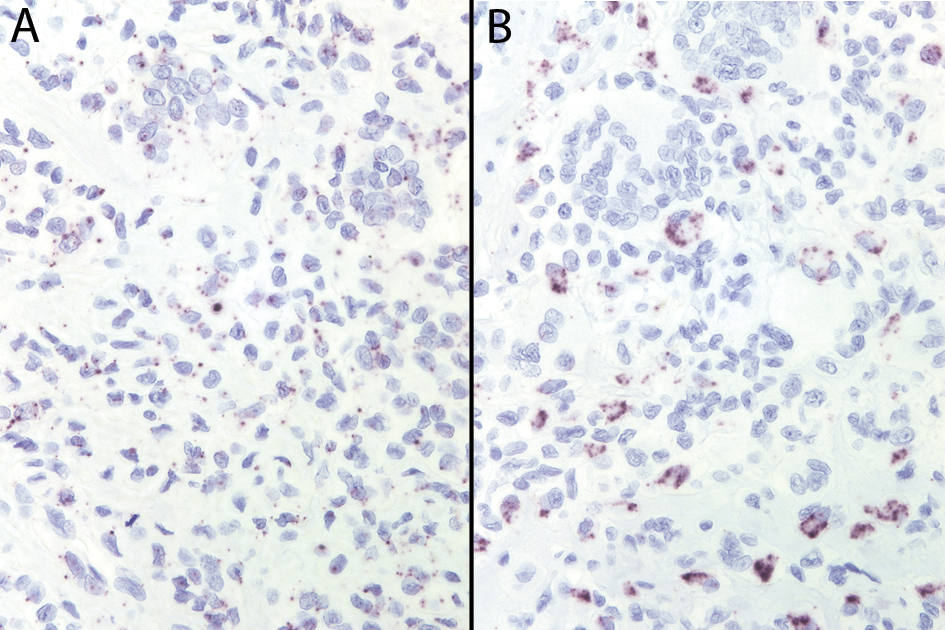
Figure 2: A: CSF1R in situ hybridization in TGCT, dark granules denote sites of hybridization. All TGCT (n=31) and PVNS (n=31) were positive for CSF1R mRNA expression in the vast majority of cells. B: CSF1 in situ hybridization in TGCT. All CSF1-positive cases of TGCT and PVNS showed similar low numbers of cells expressing CSF1. | |||||||||||||||||||||||||||||||||||||||||||||||||||||||||||||||||||||||||||||||||||||||||||||
| Figure 2 available as a JPEG file | ||||||||||||||||||||||||||||||||||||||||||||||||||||||||||||||||||||||||||||||||||||||||||||
|
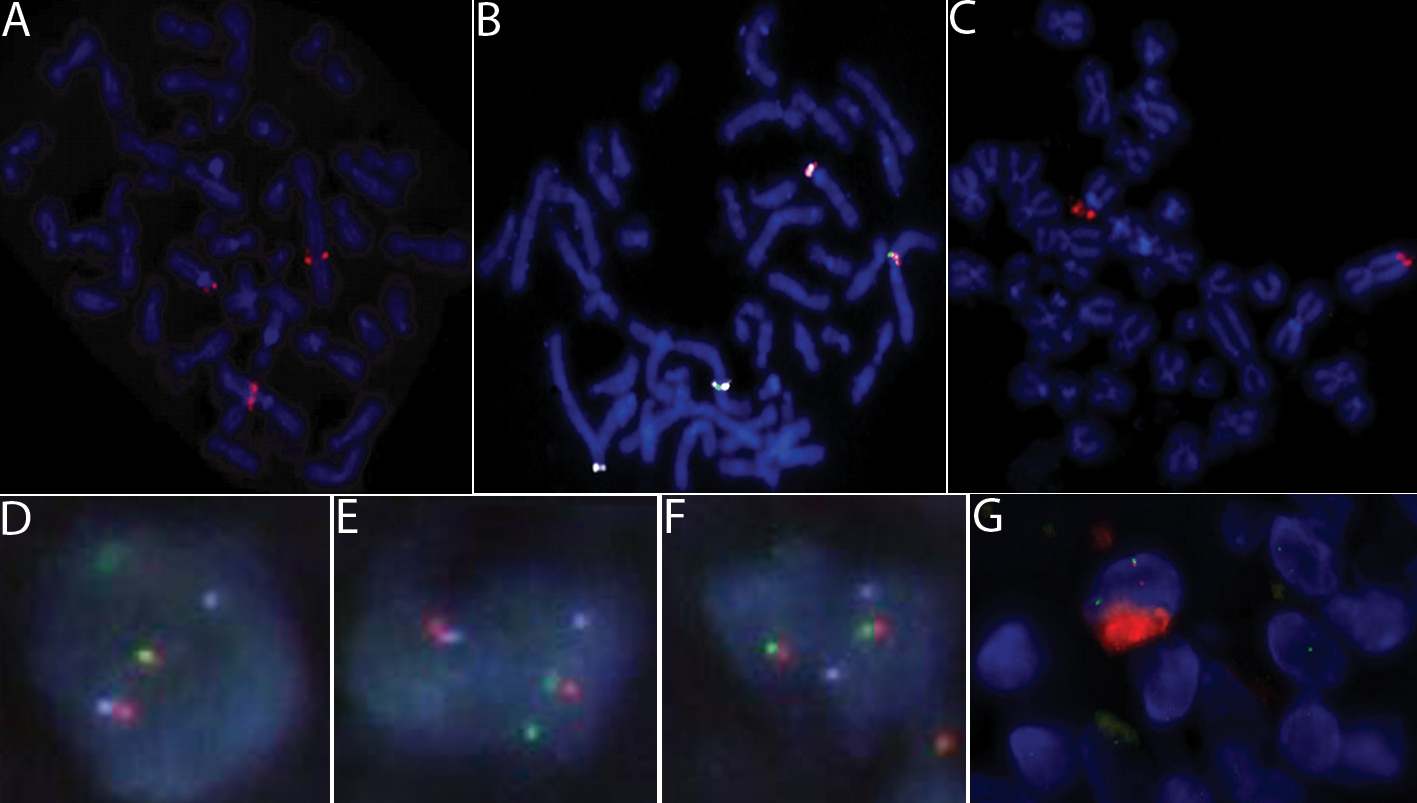
Figure 3: A: FISH with the CSF1-spanning BAC probe RP11-19F3B on TGCT confirms that the CSF1 gene is split by the translocation in TGCT. B: The fusion of CSF1 and COL6A3 was confirmed by FISH. The COL6A3 locus represented by CTD-2344F21 (labeled in white), the region telomeric to CSF1 represented by RP11-96F24 (labeled in green) and the region centromeric to CSF1 represented by RP11-354C7 (labeled in orange). C: In metaphase TGCT, FISH with BAC probe RP11-25803 that covers the region telomeric to COL6A3, which fails to split. D and E: Two nuclei with the fusion of CSF1 and COL6A3 demonstrated by FISH on interphase TMA sample of TGCT. The COL6A3 locus represented by CTD-2344F21 (labeled in white), the region telomeric to CSF1 represented by RP11-96F24 (labeled in green) and the region centromeric to CSF1 represented by RP11-354C7 (labeled in orange). F: Lack of translocation in a nucleus from the same sample as D and E shows an intact CSF1 gene. | |||||||||||||||||||||||||||||||||||||||||||||||||||||||||||||||||||||||||||||||||||||||||||||
| Figure 3 available as a JPEG file | ||||||||||||||||||||||||||||||||||||||||||||||||||||||||||||||||||||||||||||||||||||||||||||
|
| Figure 4: Unsupervised hierarchical clustering of 8 cases of PVNS (in red), 7 cases of TGCT (purple), 6 cases of SFT (blue) and 7 cases of DTF (green) based on expression profiling with DNA microarrays. In the heatmap, red represents high expression, black represents median expression, green represents low expression, and grey represents no data. Gene array data is available in a searchable format in Supplemental Figure 6 below. .jpg)
Figure 4 available as a JPEG file |
| Figure 5: Figure 5. Double staining for CSF1 mRNA and CD163 or CD68 protein in TGCT. A: CD163 immunoreactivity. B: CSF1 in situ hybridization with fluorescence (red). C: Combined panels A and B; CSF1 in situ hybridization with fluorescence (red) and CD163 immunohistochemistry. D: CD68 immunoreactivity with fluorescence (red). E: CSF1 in situ hybridization with fluorescence (green). F: Combined panels D and E; CSF1 in situ hybridization with fluorescence (green) and CD68 (red) immunohistochemistry. See sidebar Images on this supplemental website for digital images of stained tumors. 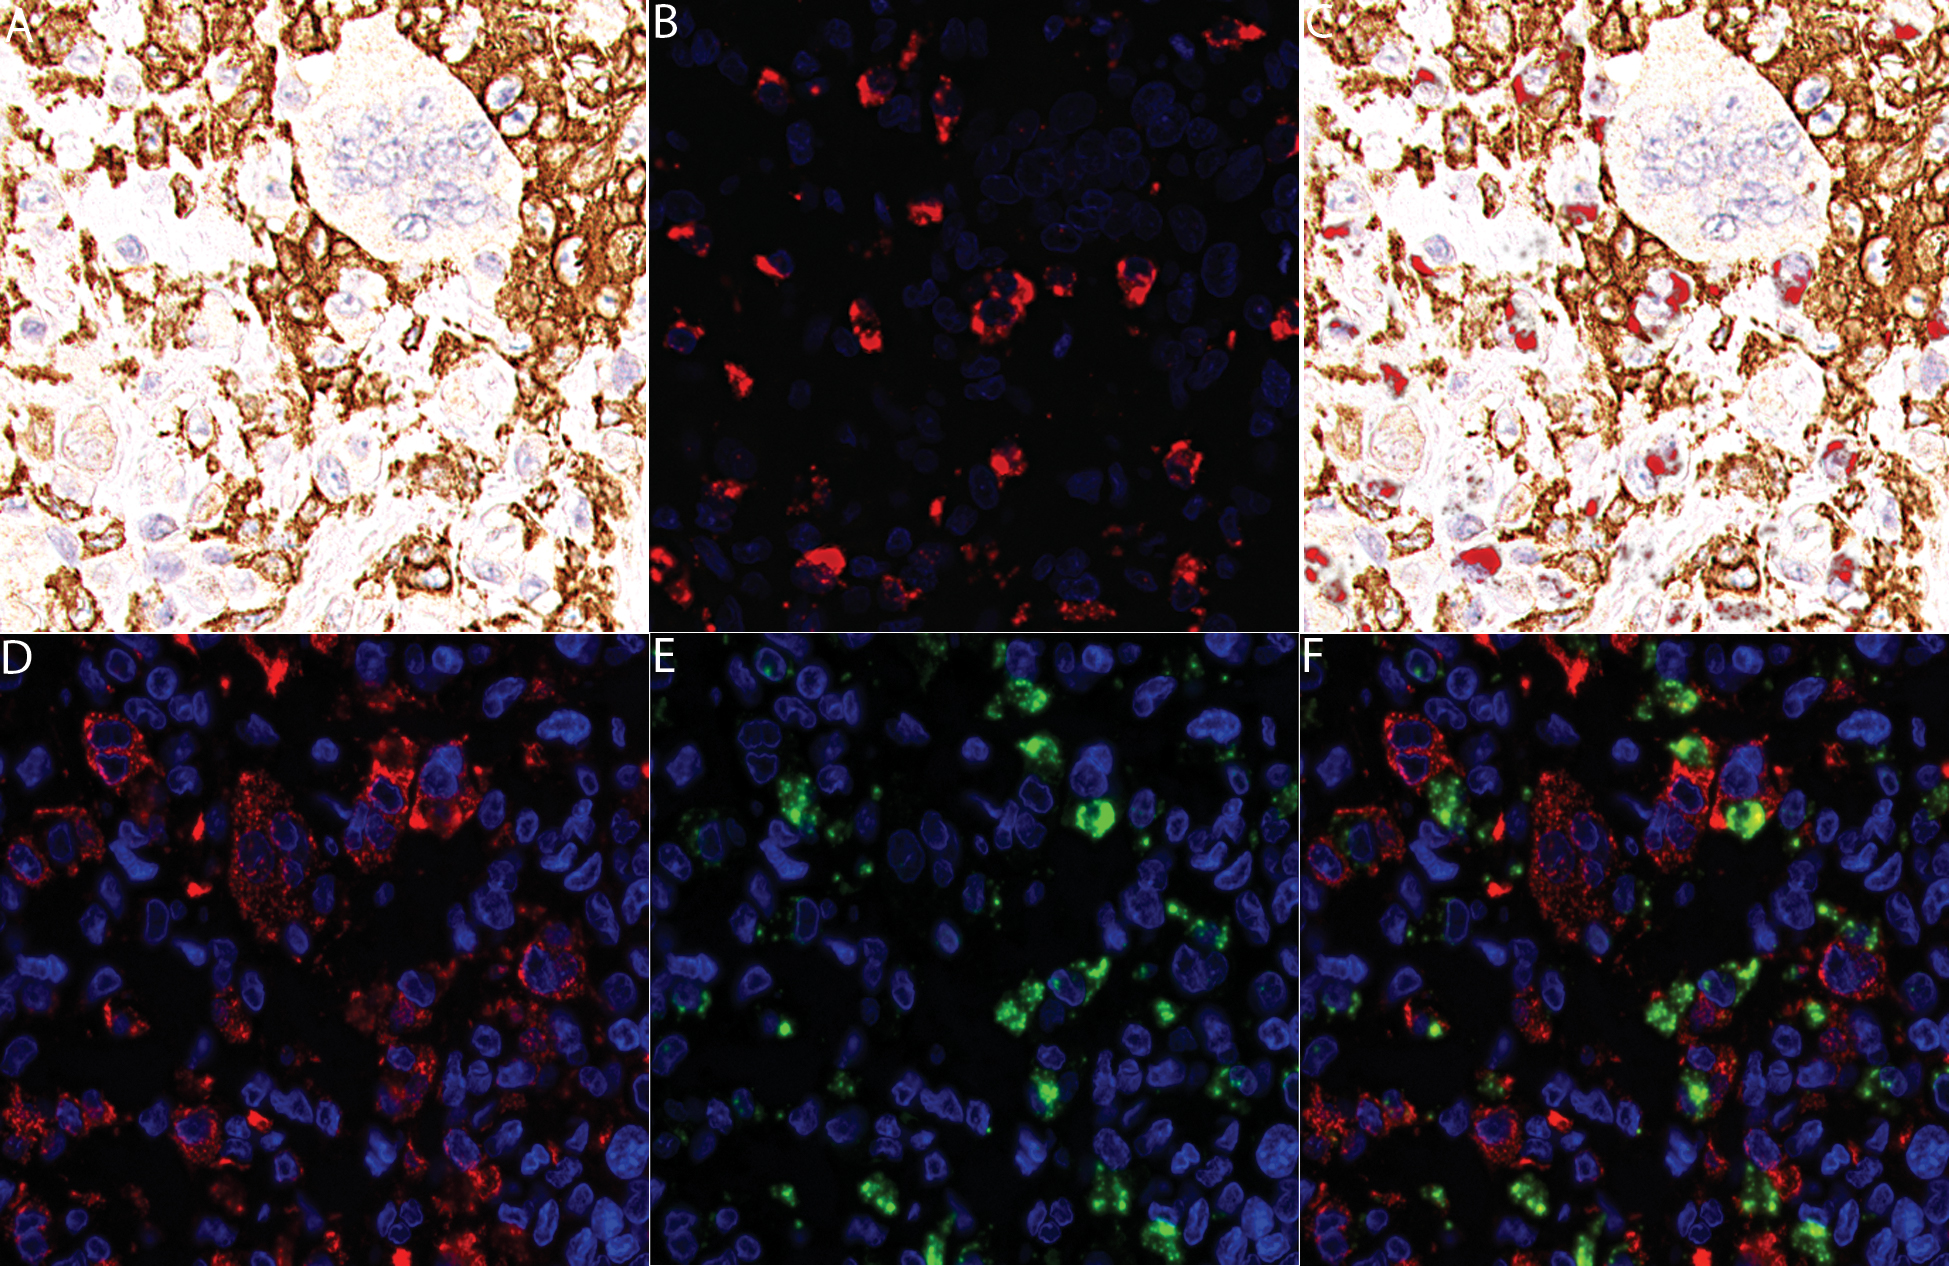
Figure 5 available as a JPEG file |
| Figure 6: CSF1 in situ hybridization in reactive synovitis showing strong reactivity in synovial lining cells. 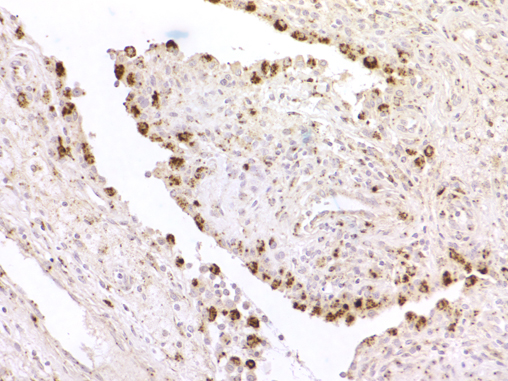
Figure 6 available as a JPEG file |
| Figure 7: Autocrine and paracrine scheme for CSF1 "landscaping" effect. CSF1 is produced by neoplastic cells with translocation resulting in increased numbers of neoplastic cells through an autocrine loop with CSF1R. CSF1 also recruits non-neoplastic CD163 and CSF1R expressing cells of monocyte/macrophage lineage. 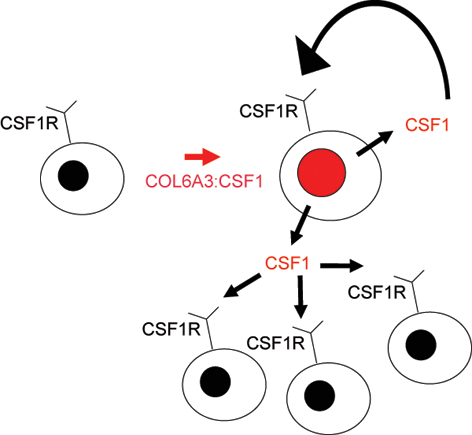
Figure 7 available as a JPEG file |
Supplemental Figures
|
| Supplemental Figure 1: A: Total number of cases that co-express one or more RTKs. KIT and PDGFRA were often co-expressed, while CSF1R was more frequently found to be co-expressed with PDGFRB. B: Remarkably, KIT and PDGFRA are both at locus 4q11-13 while CSF1R and PDGFRB are both at locus 5q33-35.
|
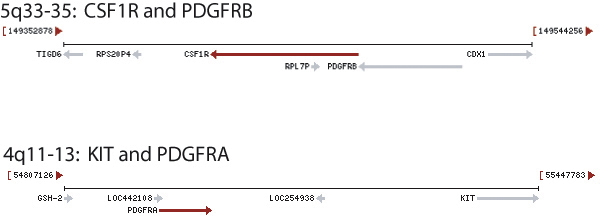
2B: Available to download as Supplemental_Figure_1B.jpg. |
| Supplemental Figure 2: Location of BAC probes used for FISH. 
Available to download as Supplemental_Figure_2.pdf. |
| Supplemental Figure 3: CSF1 translocation frequency was determined by FISH with BAC probes RP11-354C7 and RP11-96F24 on TMAs containing a total of 31 TGCT and 41 PVNS represented as 2 mm cores. The probe was initially screened in a TMA containing 507 soft tissue tumors to determine the background signal. A cutoff of equal to or greater than 2 breaks per 100 nuclei was selected for a positive score. Of 23 scorable TGCT, 20 cases were positive for the break while 9 of 26 scorable PVNS cases were positive. The percentage of cells positive for the break, as indicated on the Y-axis, was 2-16%. 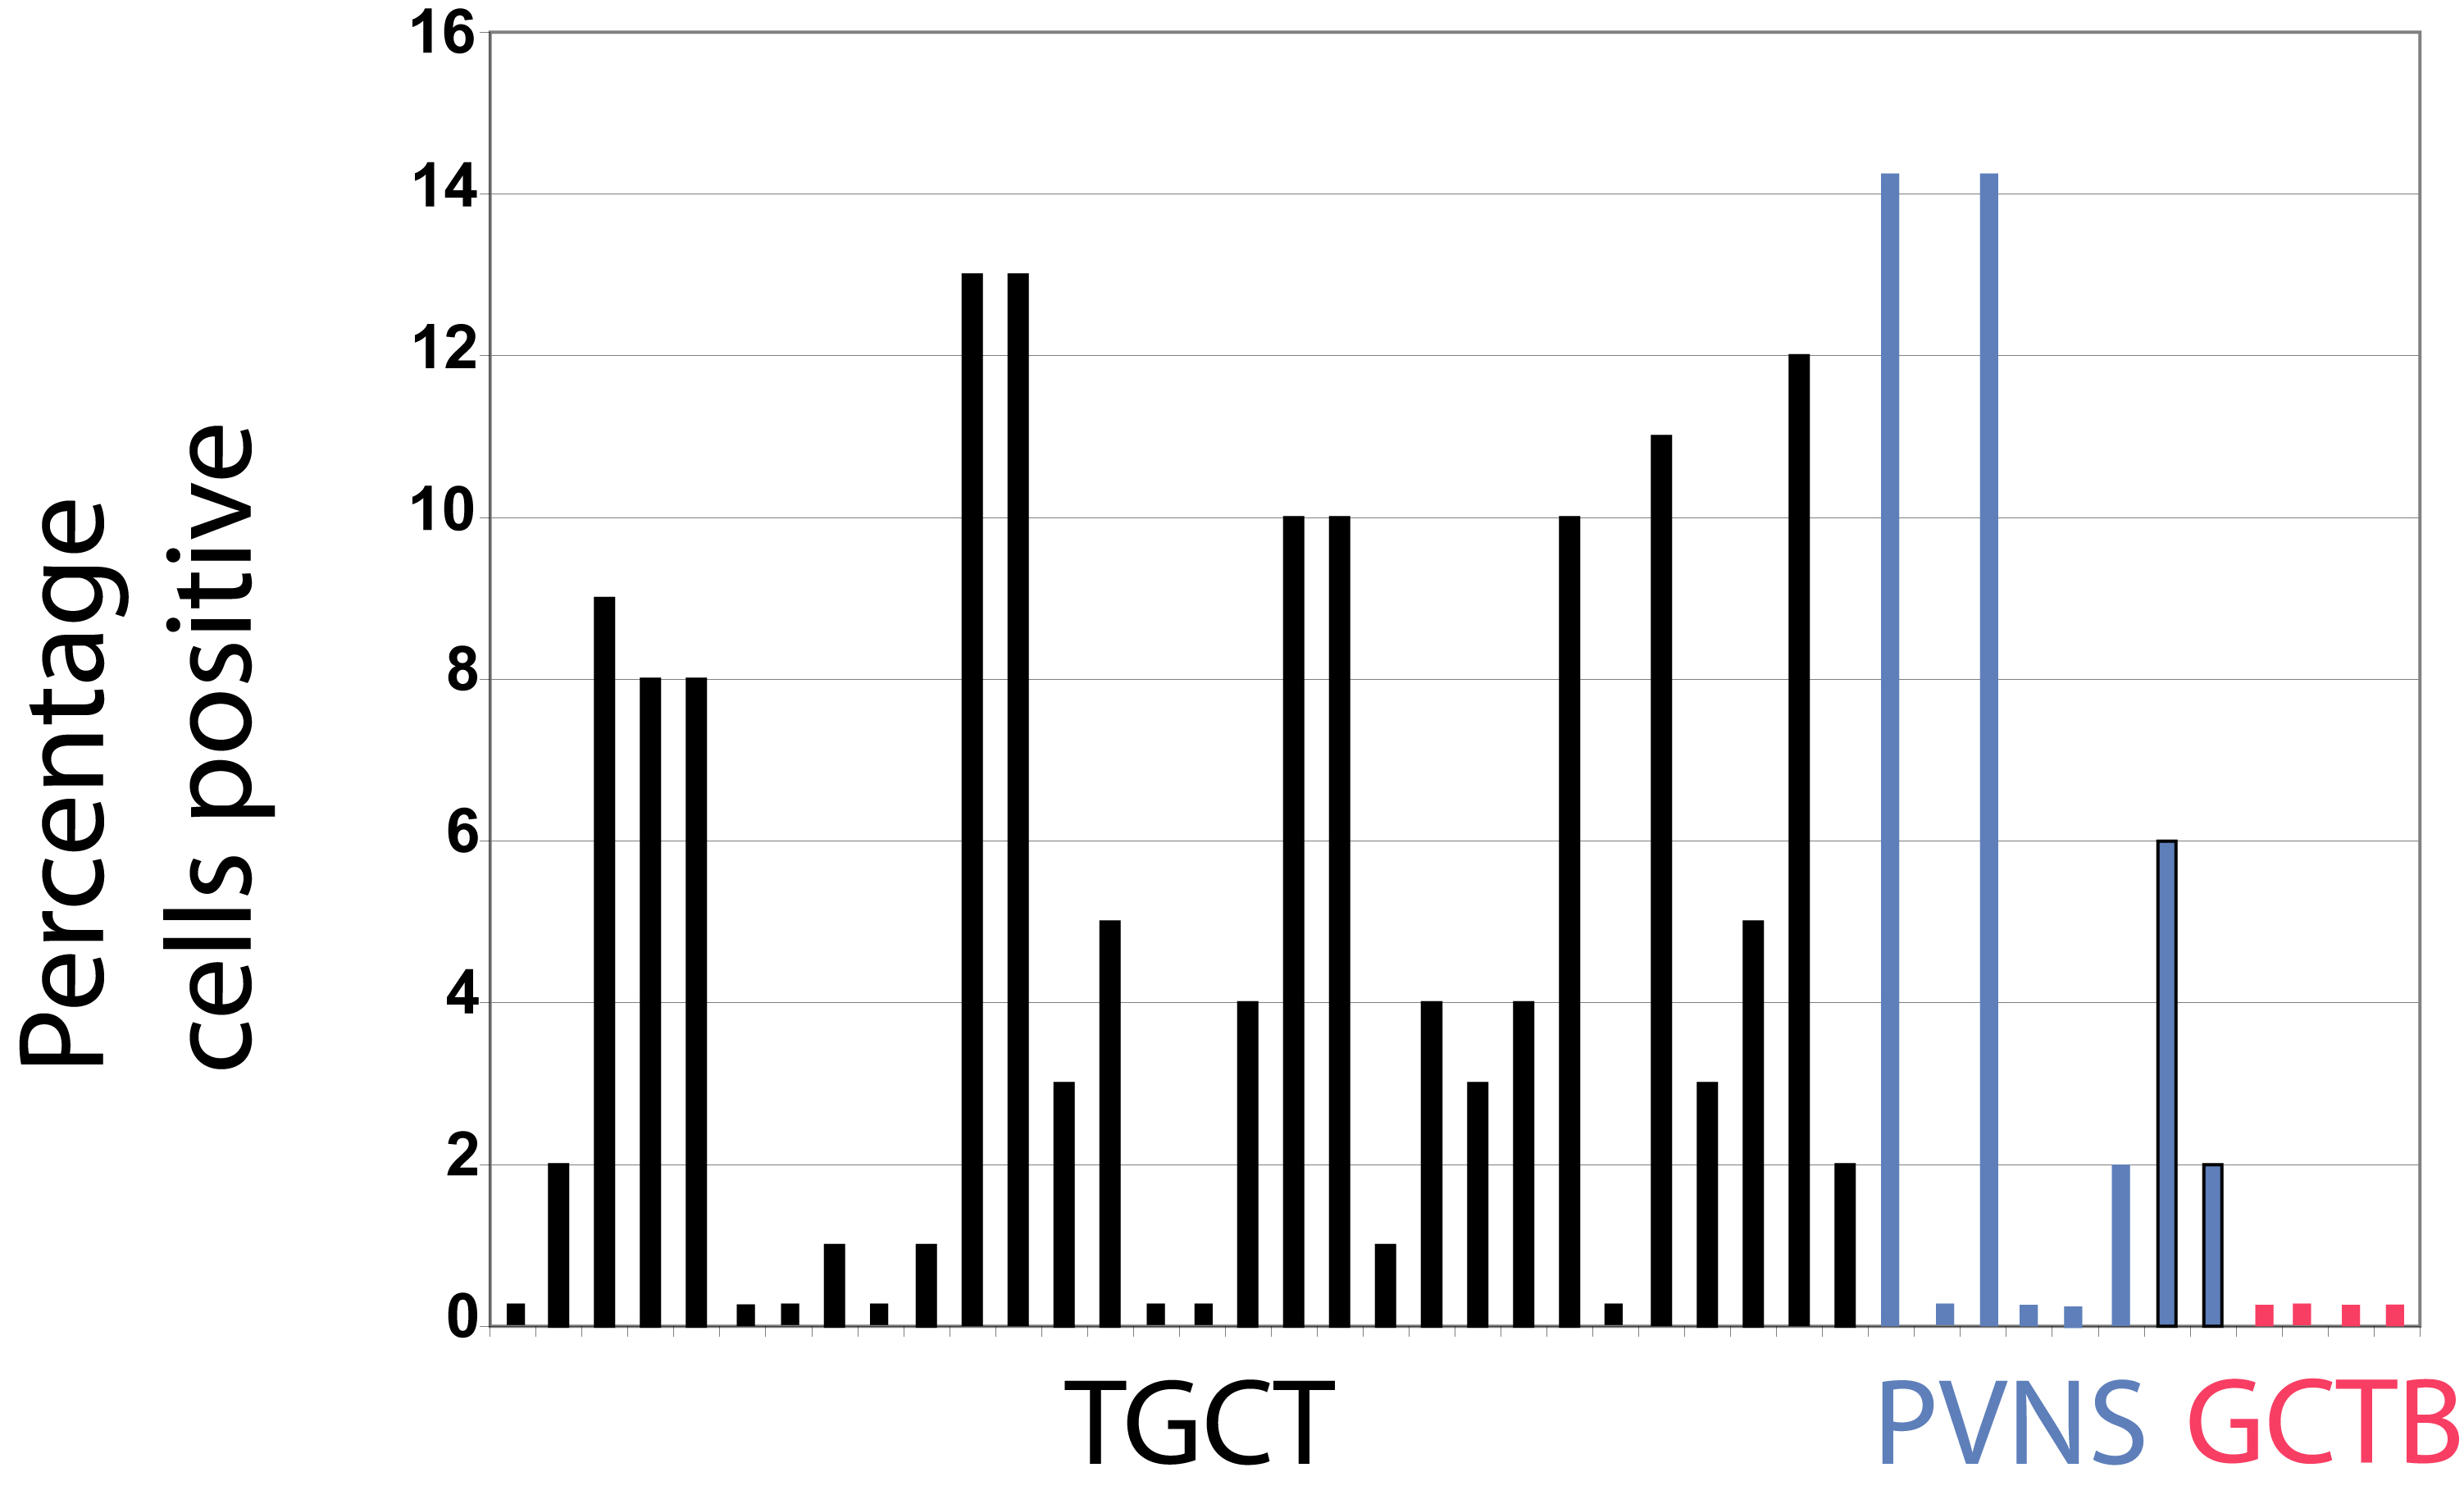
Available to download as Supplemental_Figure_3.jpg. |
| Supplemental Figure 4: A: Significance Analysis of Microarray (Tusher et al. PNAS 98, 5116-21 (2001)) was performed on the dataset represented in Figure 4. 1252 clone IDs were found to be significant (positively and negatively) for TGCT and PVNS in a dataset containing SFT and DTF. B: GO termfinder analysis was performed on the positive clone IDs as previously described (Boyle et al. Bioinformatics 20, 3710-5 (2004)). 479 clone IDs were associated with ontology in the GO termfinder database. The significant gene ontology terms based on corrected P-values are listed. C: The gene ontology terms are represented graphically. 
Available to download as Supplemental_Figure_4A.xls. |
Available to download as Supplemental_Figure_4B_17140.xls. |
Available to download as Supplemental_Figure_4C.pdf. |
| Supplemental Figure 5: Tissue Microarray Explorer 
Supplementary Figure 5 is available as an interactive page under the Data sidebar. |
| Supplemental Figure 6: Gene Microarray Explorer 
Supplementary Figure 6 is available as an interactive page under the Data sidebar. |
Supplemental Tables
|
| Supplemental Table 1: Summary of TMAs 117, 137 and 153
|
| ||||||||||||||||||||||||||||||||||||||||||||||||||||||||||||||||||
|
Supplemental Table 2: Primer sequences for antisense ISH probes: F, forward primer; R, reverse primer. |
| ||||||||||||||||||||||||||||||||||||||||||||||||||||||||||||||||||||||||||||||||||||||||||||