Robert B. West, Brian P. Rubin, Melinda A. Miller, Subbaya Subramanian, Gulsah Kaygusuz, Kelli Montgomery, Shirley Zhu, Robert J. Marinelli, Alessandro De Luca, Erin Downs-Kelly, John R. Goldblum, Christopher L. Corless, Patrick O. Brown, C. Blake Gilks, Torsten O. Nielsen, David Huntsman, Matt van de Rijn
| Home |
|
Home |
| Figures |
|
Figures and Tables |
| Images |
|
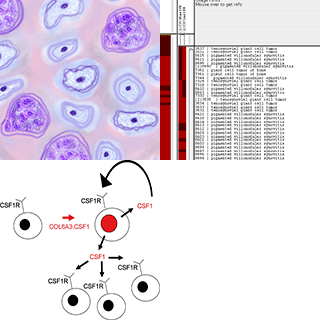
View the CSF1 tissue array images |
| Data |
|
View the CSF1 data |
| Methods |
|
Supplementary materials and methods |
| WebPortal |
|
Stanford Tissue Microarray Consortium Web Portal |
| Authors |
|
Authors |
| Search & Explore Data |
|
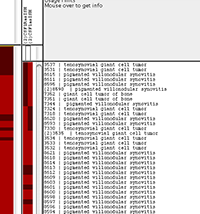
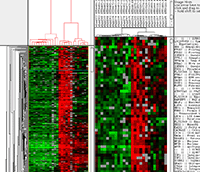
CaseXplorer is a web server application that allows the exploration of large bodies of tissue expression data generated by immunohistochemistry and in situ hybridization experiments using a Web Browser program as it's interface. CaseXplorer has evolved from GeneXplorer. GeneXplorer is a web server application that allows the exploration of large bodies of gene expression data generated by DNA microarray experiments using a Web Browser program as it's interface. The data is displayed in a "Radar" view on the left, and a "Zoom" view on the right. The "Radar" gives an overview of the general patterns observable in the expression data after it has been submitted to a clustering procedure. This clustering process reorders the data by similarity and was recently described by Eisen et al. (1998). By clicking on a region of interest in the "Radar" view, a regional enlargement will be displayed in the "Zoom" view. Here the names of genes are visible, including links to the SOURCE project at Stanford. |
|
| Follow this link (or click on the image) to explore details of the tissue array expression heatmap for CSF1 antisense ISH and CSF1R antisense ISH (opens a new window): | |
|
CaseXplorer Supplemental Figure 5. Tissue Microarray expression data. |
 |
| Follow this link (or click on the image) to explore details of the gene expression heatmap (opens a new window): | |
|
GeneXplorer Supplemental Figure 6. Gene Microarray expression data. |
 |