|
Home
|
Immunohistochemical and Clinical Characterization of the Basal-like Subtype of Invasive Breast Carcinoma Homepage
|
|
CaseXplorer
|
Treeview CaseXplorer
|
|
Figures
|
Figures from the paper
|
|
WebPortal
|
Stanford Tissue Microarray Consortium Web Portal
|
|
Authors
|
Authors
|
|
|
|
Figures
|
 Figure
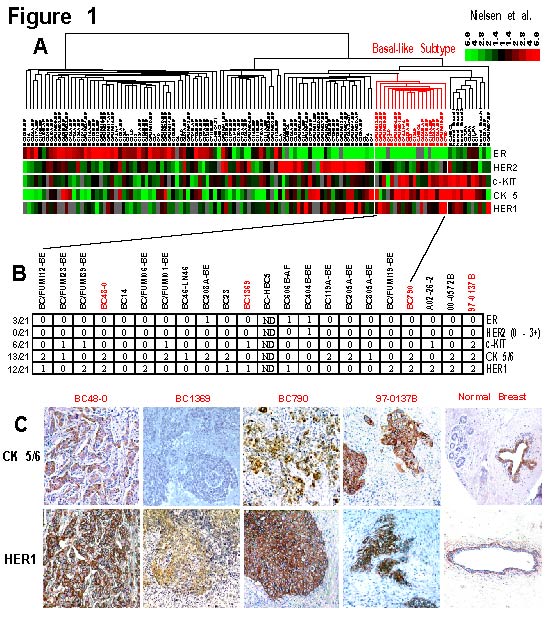
1. Gene expression patterns in basal-like tumors and their correlation with immunohistochemistry.
A) The 115 patient/tumor sample dendrogram was taken from the hierarchical clustering analysis presented in
Sorlie et al. 2003 (2); the tumors were grouped using the breast "intrinsic" gene list based upon 50 paired samples.
The BBC are identified in red. The gene expression data for ER, HER2, c-KIT, CK5 and HER1 are shown with red
squares representing the highest average expression, black representing average gene expression and green r
epresenting the lowest below average. B) 21 BBC identified by gene expression profiling were tested and scored
by IHC for CK5/6, HER1, c-KIT, ER and HER2 (0 = negative, 1 = weak and/or focal staining, 2 = strong diffuse
staining), except for HER2, which was scored using a standard (0-3+) scale. ND = not determined. C) Representative
immunostaining results for 4 basal-like tumors and a normal breast
sample for CK5/6 and HER1. Warning: Large file 17MB Figure
1. Gene expression patterns in basal-like tumors and their correlation with immunohistochemistry.
A) The 115 patient/tumor sample dendrogram was taken from the hierarchical clustering analysis presented in
Sorlie et al. 2003 (2); the tumors were grouped using the breast "intrinsic" gene list based upon 50 paired samples.
The BBC are identified in red. The gene expression data for ER, HER2, c-KIT, CK5 and HER1 are shown with red
squares representing the highest average expression, black representing average gene expression and green r
epresenting the lowest below average. B) 21 BBC identified by gene expression profiling were tested and scored
by IHC for CK5/6, HER1, c-KIT, ER and HER2 (0 = negative, 1 = weak and/or focal staining, 2 = strong diffuse
staining), except for HER2, which was scored using a standard (0-3+) scale. ND = not determined. C) Representative
immunostaining results for 4 basal-like tumors and a normal breast
sample for CK5/6 and HER1. Warning: Large file 17MB
|
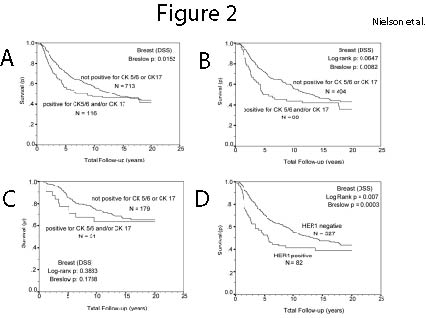 Figure 2.
 Kaplan-Meier survival curves
based upon basal cytokeratin and HER1
staining. A)Kaplan-Meier disease-specific
survival (DSS) curve for 829 tumours assessed
for cytokeratin 5/6 and cytokeratin
17. B)Kaplan-Meier disease-specific survival
(DSS) curve for 472 lymph node positive breast
cancers assessed for cytokeratin 5/6 and
cytokeratin 17. C)Kaplan-Meier
disease-specific survival (DSS) curve for 210
lymph node negative breastcancers assessed for
cytokeratin 5/6 and cytokeratin 17. D)Kaplan
Meier disease-specific survival (DSS) curve in
609 breast cancers assessed for HER1
immunostaining. Figure 2.
Figure 2. Kaplan-Meier survival curves
based upon basal cytokeratin and HER1
staining. A)Kaplan-Meier disease-specific
survival (DSS) curve for 829 tumours assessed
for cytokeratin 5/6 and cytokeratin
17. B)Kaplan-Meier disease-specific survival
(DSS) curve for 472 lymph node positive breast
cancers assessed for cytokeratin 5/6 and
cytokeratin 17. C)Kaplan-Meier
disease-specific survival (DSS) curve for 210
lymph node negative breastcancers assessed for
cytokeratin 5/6 and cytokeratin 17. D)Kaplan
Meier disease-specific survival (DSS) curve in
609 breast cancers assessed for HER1
immunostaining. |
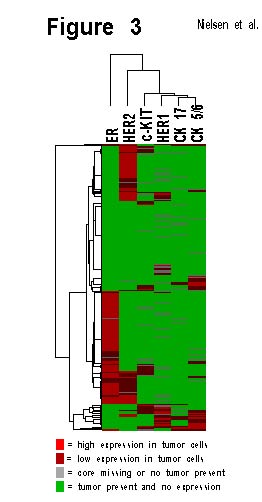 Figure 3. Hierarchical cluster analysis of breast carcinoma tissue microarray immunostaining results.
The six markers evaluated in this study (ER, HER1, HER2, c-KIT, CK5/6 and CK17) were scored and used
in a clustering analysis where each row represents a different tumor, and each column represents a
different IHC stain. The analysis shows that the basal-like markers stained similar cases, as indicated
by the very short dendrogram branches linking these markers. Figure 3. Hierarchical cluster analysis of breast carcinoma tissue microarray immunostaining results.
The six markers evaluated in this study (ER, HER1, HER2, c-KIT, CK5/6 and CK17) were scored and used
in a clustering analysis where each row represents a different tumor, and each column represents a
different IHC stain. The analysis shows that the basal-like markers stained similar cases, as indicated
by the very short dendrogram branches linking these markers. |
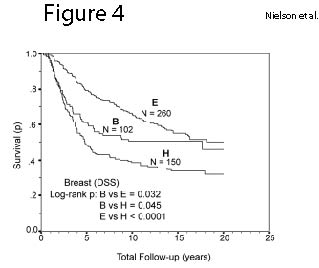 Figure 4.
Kaplan Meier disease specific survival (DDS) analysis of breast
carcinoma subtypes defined by ER, HER2, CK5/6
and HER1 immunohistochemistry. Group B (the
basal-like subtype) is defined as negative for
ER, negative for
HER2 and positive for HER1 and/or CK5/6.
Group E (the luminal subtype) are positive for
ER and negative for HER2. Group H (clinically
HER2 3+) are positive for HER2. Figure 4.
Kaplan Meier disease specific survival (DDS) analysis of breast
carcinoma subtypes defined by ER, HER2, CK5/6
and HER1 immunohistochemistry. Group B (the
basal-like subtype) is defined as negative for
ER, negative for
HER2 and positive for HER1 and/or CK5/6.
Group E (the luminal subtype) are positive for
ER and negative for HER2. Group H (clinically
HER2 3+) are positive for HER2.
|
|
|