|
|
|
|
Figures
|
We have made the figures available in both HTML and PDF formats, to facilitate online viewing. If you prefer to download the PDF figures to your PC directly, it is possible to get them from our web site using HTTP in an equivalent manner to FTP. In order to download the figures, do the following: If using a PC, right click on each PDF file using your mouse and then choose Save Target As. If using MacOS, option-clicking is the equivalent command.
|
|
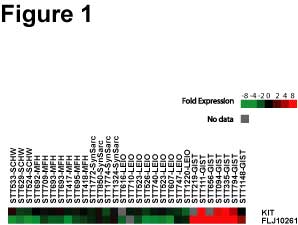
Figure 1: Gene array measurement of KIT and DOG1 mRNA expression in 30 soft tissue tumors
Available both as:
- HTML Document
- Portable Document Format
|
|
|
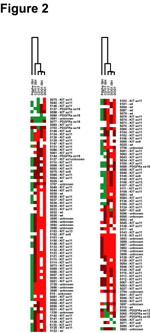
Figure 2:Hierarchical clustering of CD117 IHC, CD117 ISH, PDGFRA ISH, DOG1 IHC, and DOG1 ISH
Available both as:
- HTML Document
- Portable Document Format
|
|
|
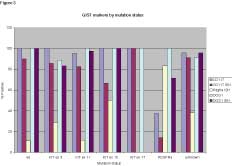
Figure 3:Staining results on GISTs for CD117 IHC, CD117 ISH, PDGFRA ISH, DOG1 IHC, and DOG1 ISH in graphic form
Available both as:
- HTML Document
- Portable Document Format
|
|
|
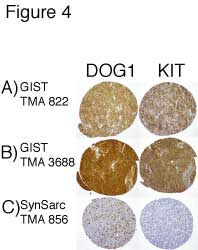
Figure 4: Immunohistochemical staining with anti-DOG1 serum (S284) and KIT on 2 GISTs
Available both as:
- HTML Document
- Portable Document Format
|
|
|
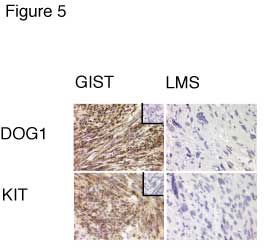
Figure 5:In situ hybridization of a GIST and leiomyosarcoma with antisense probes to DOG1 and KIT on a GIST and a leiomyosarcoma (LMS)
Available both as:
- HTML Document
- Portable Document Format
|
|
|
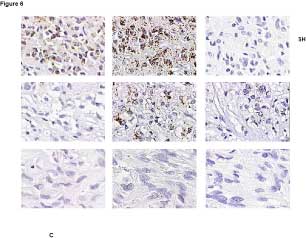
Figure 6:In situ hybridization of KIT, DOG1, and PDGFRA with GISTs
Available both as:
- HTML Document
- Portable Document Format
|
|
|
|
|
[ Home
| CaseXplorer
| Figures
| WebPortal
| Authors
]
|
|