| Home |
|
GIST Mutations Homepage |
| Figures |
| Figures and Tables |
| Data |
| Raw data |
| Authors |
|
People who contributed to the paper |
| Web Portal |
| Stanford Tissue Microarray Consortium Web Portal |
| Figures | |
|
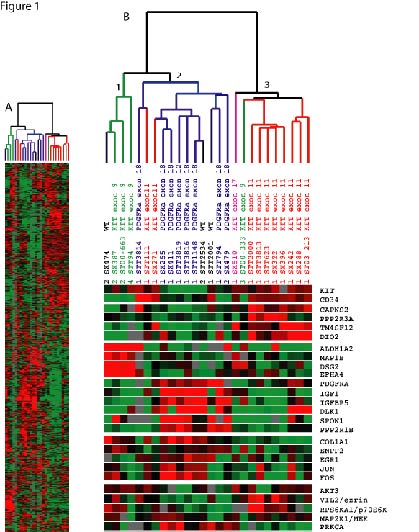
Figure 1: Unsupervised hierarchical cluster analysis of gene expression profiles of 26 GIST tumors. Each row represents the relative levels of expression for a single gene, centered at the geometric mean of its expression level across the 26 samples. Each column shows the expression levels for a single sample. The red or green color indicates high or low expression, respectively. A: Overview of expression pattern of the 1875 genes used for the hierarchical clustering analysis. B: The same clustering analysis is shown in more detail with a subset of genes that are differentially expressed in each GIST mutant subtype. | |
| Available both as a PDF file and a JPEG file |
|
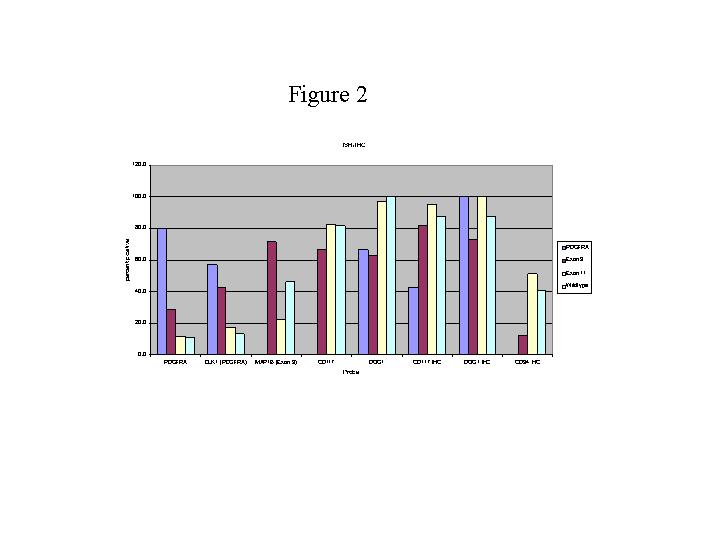
Figure 2: Graph representing the percentage of positive staining for in situ probes on the 127 case TMA. | |
|
Available as a Spreadsheet file. |
|
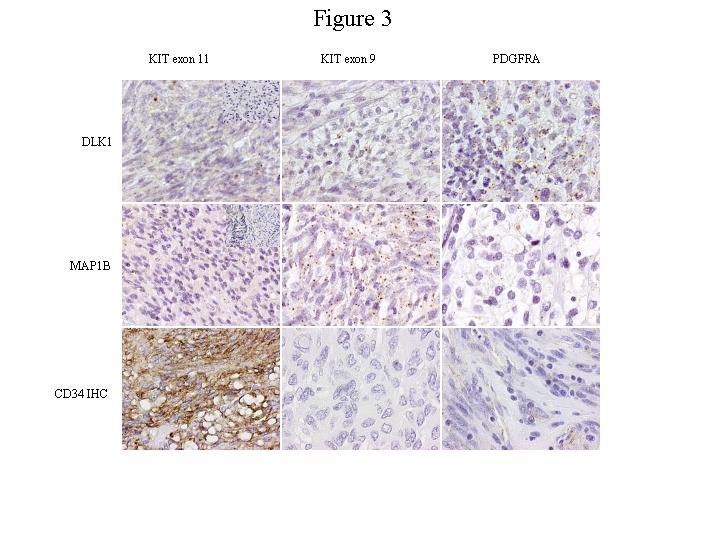
Figure 3: Representative TMA cores of KIT exon 11, KIT exon 9 and PDGFRA mutants probed for DLK1, MAP1B by ISH and CD34 by IHC. Corresponding case numbers are given for each selected core. Insets in the figure show the sense strand control probe. The complete dataset including 809 digital images is available at http://smd.princeton.edu/. | |
| Available both as a PDF file and a JPG file |
|
Figure 4: Proteins relevant in KIT and/or PDGFR signaling pathways were evaluated by immunoblotting of whole cell lysates from primary GISTs with KIT exon 9, KIT exon 11 and PDGFRA mutations. The proteins were identified based on cDNA microarray evidence for differential expression of the corresponding genes (VIL2/ezrin, PRKCQ, PRKCA and P70S6K) in the various mutation groups. Relative levels of ezrin expression are shown beneath each band in the top panel. | |
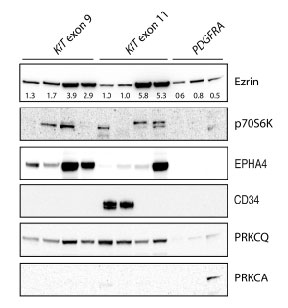
| Available both as a PDF file and a JPG file |
|
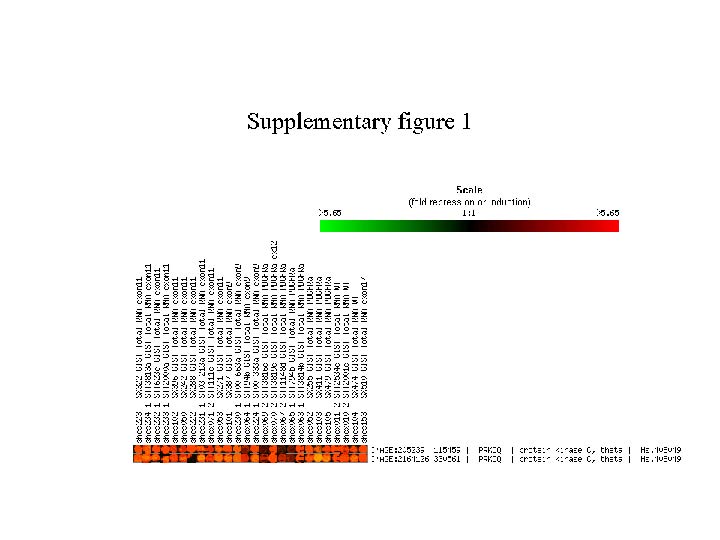
Supplementary Figure 1: | |
|
|
|
Table 1: Clinical data for all the 26 GIST tumors used in the gene expression study. | |
|
|
|
Table 2a: First 50 genes with highest differential expression in KIT exon 11 mutant GISTs | |
|
|
|
|
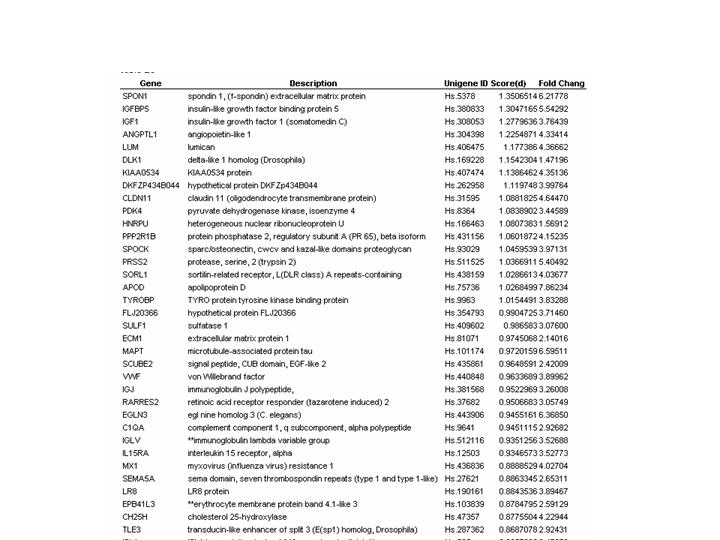
Table 2b: Gene list with highest differential expression in KIT exon 9 mutant GISTs | |
|
|
|
|
Table 2c: First 50 genes with highest differential expression in PDGFRA mutant GISTs | |
|
|
|
|
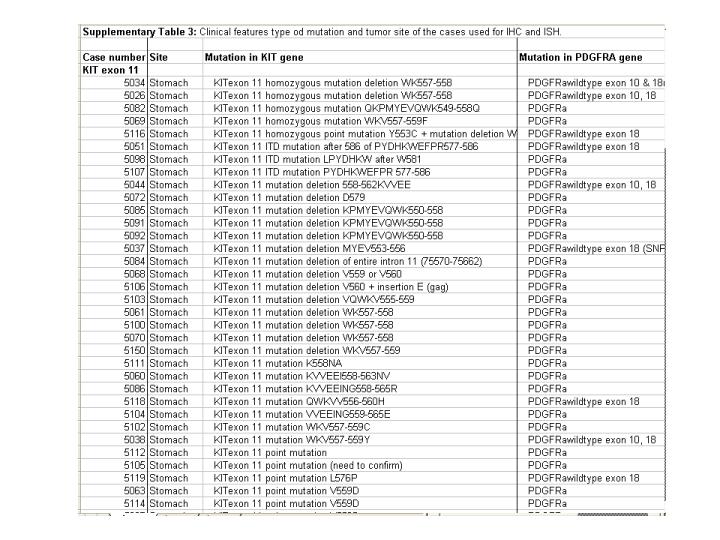
Supplementary Table 1: A detailed table that shows the site of origin and mutation type of the 127 GIST cases on the TMA. Note that the expression of CD34 by immunohistochemistry within the group of GIST cases with exon 11 mutations is found in gastric but not small bowel lesions. This is similar to results reported by Antonescu et al. (Clin Cancer Research 2004, 10:3282-90) on gene array findings but no correlation with mutation type was shown in that report. Here we show that all PDGFRA mutated cases are located in the stomach and that all are negative for CD34 by IHC. Thus there is no absolute correlation between CD34 reactivity and tumor location in the stomach or small bowel. A score of 2 represents strong positive, 1 for weak positive and -2 for no staining. | |
|
|
|
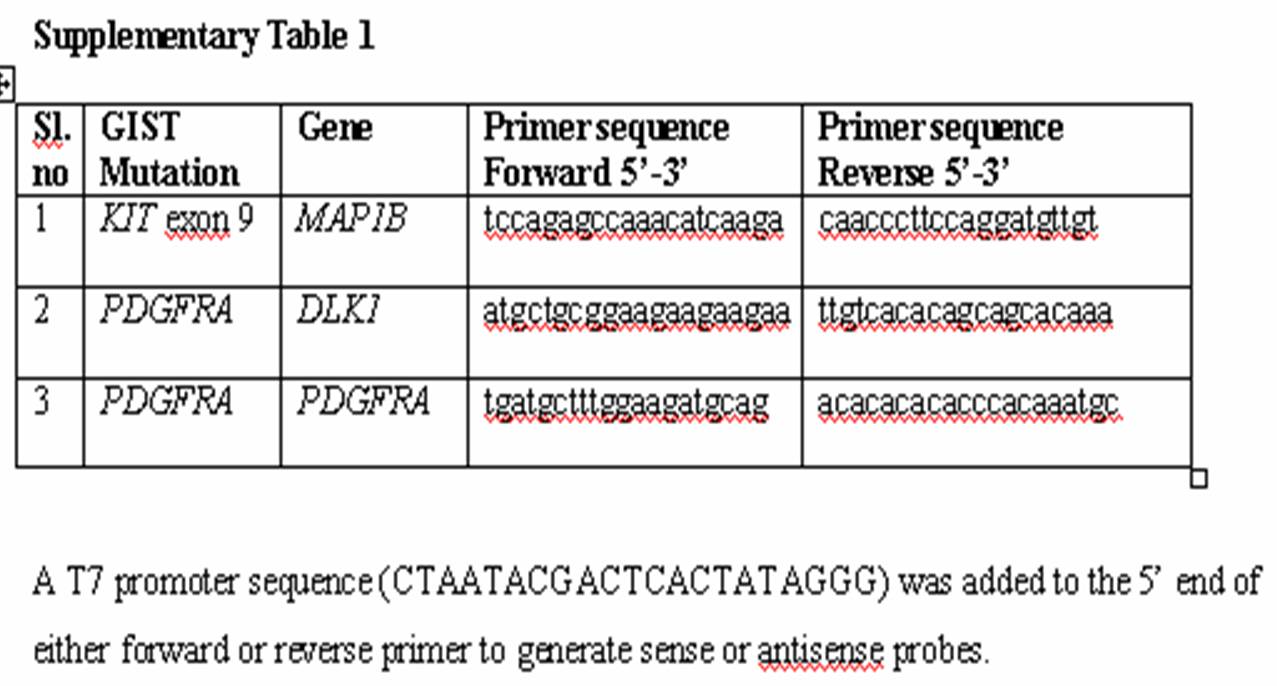
Supplementary Table 2: T7 promoter sequence (CTAATACGACTCACTATAGGG) was added to the 5' end of either forward or reverse primer to generate sense or antisense probes. | |
|
|
|
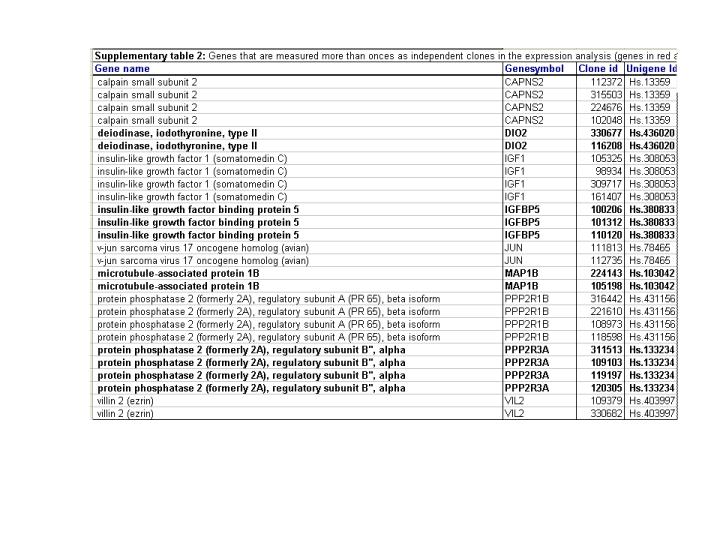
Supplementary Table 3: Nine genes described in the manuscript were measured by multiple cDNA fragments on the gene microarrays, as indicated by the clone ID. The number of cDNA fragments (Clone id in column 3) per gene ranged from 2-4. For each gene the expression levels across the tumors tested was highly similar for the different cDNA fragments such that in each case the different cDNA fragments were clustered together. This finding indicates a very high degree of correlation of the expression data within the dataset. | |
|
|
|
SAM Gene List KIT exon 9 SAM Gene List KIT exon 11 SAM Gene List PDGFRA | |