|
Open the TreeView program. If you don't have it, download
it from http://rana.lbl.gov/EisenSoftware.htm.
Go to File -> Open, and open your newly clustered
file (e.g. 4.cdt, in this example). You may adjust the
thumbnail and zoom image pixel size (defined for each individual
datapoint, represented by a single block of color) to your
preferences. You will also need to adjust the contrast to 2
(representing a dynamic range of 2-fold induction or 2-fold repression
in gene microarrays, for which TreeView was originally
designed).
Treeview Options
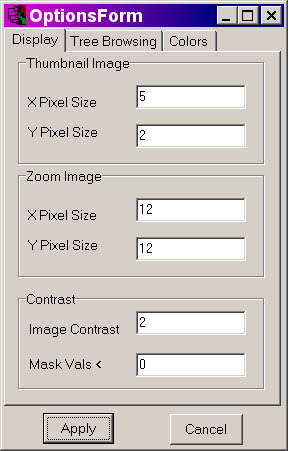
If you use the parameters indicated in the screenshot
above, and using the demo file 4.cdt, you should get the following:
TreeView Program Screenshot
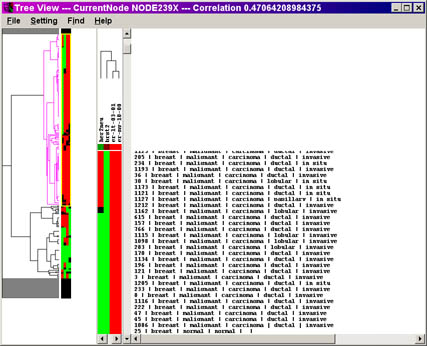
Click on the image for a larger view of the picture.
You may recall that the scoring data is represented in the
following manner:
| Score |
Description |
Treeview
score |
Appearance
under
Treeview |
|
|
Missing datapoint
|
|
|
| 0
|
Negative
|
-2
|
|
| 1
|
equivocal/uninterpretable
|
0
|
|
| 2
|
weak
|
1
|
|
| 3
|
strong
|
2
|
|
You may now browse your dataset for additional analysis.
To use TreeView with Stainfinder, proceed to the walkthrough link below.
Back to Step 3.
Walkthrough for setting up Stainfinder
Return to the walkthrough
overview page.
|