|
After the TMA-Deconvoluter has completed its operation, you
will find yourself back at the main screen of the TMA-Deconvoluter (at
the "Control") worksheet. You will notice that the output appears in
additional worksheets within the TMA-Deconvoluter, and that a report
of the activity of the TMA-Deconvoluter appears, as shown below:
Outputted Filenames

The "Processed" column indicates whether or not the raw
scoring workbook was successfully processed. The "Output worksheet"
column indicates the name of the worksheet within the TMA-Deconvoluter
that contains the output data, and the "Output filenames" column
contains the file names of the output files. If you had specified
your own filenames, these would remain unchanged, and the
corresponding files (4.txt, 5.txt in this example) would appear in the
current working directory. If you had not specified any file names,
the file names will be the same as the worksheet names.
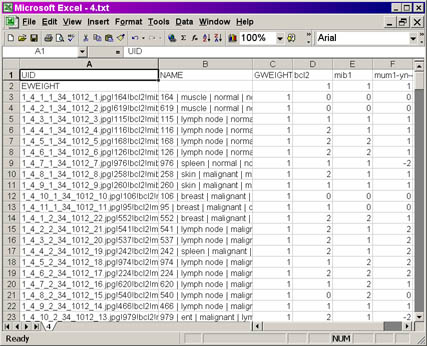
Opening one of the output file names, or clicking on the
corresponding worksheet tab within the TMA-Deconvoluter, should result
in the screen below (if you had chosen to output in the PCL format):
PCL output file screenshot

Click on the image for a larger view of the picture.
For those of you familiar with the PCL (Pre-CLuster)
format, you will recognize the formatting of the output.
- In Column
A is the UID (Unique IDentifier) column, which contains the
information passed on by TreeView to the Stainfinder program (for more
information on this, please refer to the Stainfinder walkthrough).
- In Column B is the NAME column, which contains the
information obtained from the lookup file. The information present is
the same as Columns A-F in the lookup file, except with a pipe ("|")
separating the different columns from that file. The unique case
identifier, followed by the diagnostic information, appears in the field.
- In Column C is the GWEIGHT column, which defines the
absolute weight each case is given in the clustering. The default value
for each case is 1, indicating that each cases given equal weight in
the hierarchical clustering. You may alter these values to some other number,
prior to clustering.
- Columns D and onward: each column represents the scoring
data obtained from a slice of your TMA. The name of the antibody, as
specified in your original raw scoring
workbook, used to stain that slice, appears at the top row of that
column.
- In Row 2 is the EWEIGHT column, which defines the absolute
weight each slice is given in the clustering. the default value for
each slice is 1, indicating that each slice is given equal weight in
the hierarchical clustering. You may also alter these values to some
other number, prior to clustering.
|
|
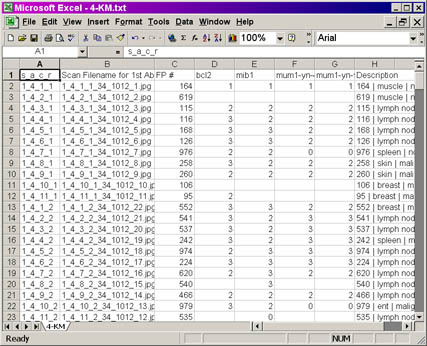
If you had chosen to output in the K-M format, you will get
the following instead:
K-M output file -- screenshot

Click on the image for a larger view of the picture.
- Column A provides information on the physical location of
the spot within the TMA in the following format, s_a_c_r,
where:
s = sector number
a = array number
c = column number
r = row number
- Column B provides information on the corresponding digital
image filename for a particular spot. The nomenclature of this
filename uses the numeric coding system used is based on the Bliss microscope system Bacus Laboratories Inc.,
consisting of seven numbers separated by underscores. This is covered in the
Stainfinder walkthrough.
- Column C consists of the unique case identifier. It is
labeled as "FP#" because the lookup files were generated from a
FileMaker Pro database in the van de Rijn laboratory.
- Columns D-G (in this example; TMAs with a larger number of
slices will occupy more columns in this range) contain the unmodified
score data of the TMA.
- Column H (in this example; in other datasets, it will be
the rightmost column in the file) contains the description for that
spot and is formatted in the same way as the NAME column in the PCL
output file.
You are now ready to proceed with hierarchical clustering
or any other sort of statistical analysis you wish to perform on your
TMA data.
Back to Step 1.
Step 3 - Clustering
Return to the walkthrough
overview page.
|

