Dealing with Quantitative Scoring Systems
The score conversion process is meant to convert the range of scores
from the user's scoring system into a range that is compatible with TreeView.
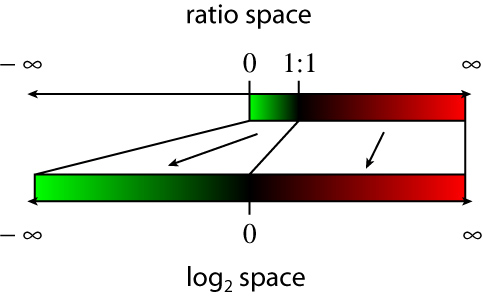
TreeView was originally designed for displaying 2-color ratiometric DNA
microarray data, where one color (green) represents a green-labeled
DNA probe, and the other color (red) represents a red-labeled probe. When
ratios are transformed into log2 space, the space between 0 and 1
(representing a higher abundance ratio of the green probe vs red probe) is transformed into
-infinity to 0, while the space between 1 and infinity (representing a higher
abundance ratio of the red probe vs green probe) is transformed into ths space between
0 and infinity. The value of 0 represents the 1:1 ratio at which the abundances of the green
and red probes are equal and is shown as black. This is illustrated below.
For those of you familiar with 2-color ratiometric DNA microarray data, the
above explanation is a very simplified one and doesn't take into account all the
possible variations done in processing the data. However, such variations aren't
relevant for our purposes here, so the explanation here should suffice.
The most important aspect of this transformation is that
the dynamic range for negative vs positive values is symmetric around 0
(represented by black).
Thus, when we adapted our current scoring system for TreeView visualization,
we designed it as shown in the table below:
| Score |
Description |
Treeview
score |
Appearance
under
Treeview |
|
|
Missing datapoint
|
|
|
| 0
|
Negative
|
-2
|
|
| 1
|
equivocal/uninterpretable
|
0
|
|
| 2
|
weak
|
1
|
|
| 3
|
strong
|
2
|
|
This meant that we needed to map our
scoring system into the number space used by TreeView and to make it symmetric
around zero. This thus accounts for the default mappings of the score conversion
process as shown in the score key above.
With the release of the TMA-Combiner, which can handle quantitative scoring systems,
we wanted to extend the ability of the TMA-Deconvoluter to handle these scoring systems.
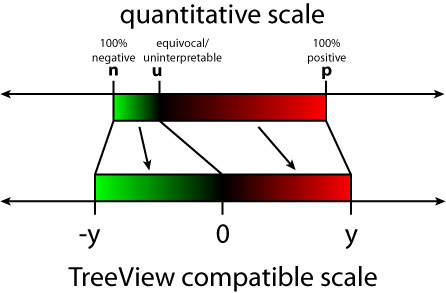
However, to keep such systems compatible with TreeView, for those who wish to cluster
their data, we devised a score transformation-scaling function that would achieve the
objective of setting 100% negative and 100% positive scores on the two extremes of the
range, with the equivocal/uninterpretable value being centered exactly in between these
two ranges.
For those who use a continuous scoring system (no discrete integers), this allows one to set a
"equivocal/uninterpretable" threshold that would then center the rest of the scoring range.
The Score Conversion Process
The actual formula as implemented in the TMA-Deconvoluter is then as follows:
For the following:
- n = 100% negative, taken to be the minimum limit of the range in the user's scoring system
- u = uninterpretable/equivocal, taken to be an intermediate value between n and p
- p = 100% positive, taken to be the maximum limit of the range in the user's scoring system
- s = score to be scaled/transformed
- t = transformed/scaled score
- y = TreeView score range limits
if s < u then
t = -y * (s - u) / (u - n)
else
t = y * (s - u) / (p - u)
end if
The end result is a scoring system with range -y to y, with u centered at 0. This is
illustrated in the diagram below.
The scaling performed is proportional and linear. You may note that the TreeView scores shown
in the discrete score conversion table used with our scoring system, as shown
in the table near the top of this
page, is still consistent with this score conversion formula for y = 2.
This scoring conversion process should be flexible for most conceivable scoring systems currently
used by pathologists. It has the following requirements:
- a minimum value that represents the highest confidence of negative staining or lowest degree of staining
- a single intermediate value that represents the lowest staining confidence or otherwise an uninterpretable/equivocal stain
- a maximum value that represents the highest confidence of positive staining or highest degree of staining
- scoring system is linearly scalable
There is currently no planned support for non-linear scaling.
|