The Output File
After the TMA-Combiner has completed its operation, you will find yourself
back at the main screen of the TMA-Combiner (at the "Control") worksheet.
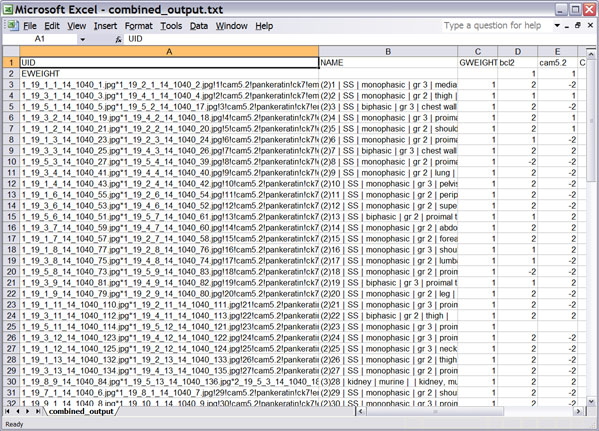
The output file should be located in the same working directory. When you
open it, you will find that the file is still in PCL format, such as in the
example below:

Click on the image for a larger view of the picture.
You will immediately notice that if your aggregate dataset contained replicate
cores, there is now only one unique entry to represent each combined set of
cores, and that such an entry will have a number in parenthesis preceding the
rest of the entry. In the "NAME" column, the core descriptor will appear
like the example below:
(2)10 | SS | monophasic | gr 3 | pelvis |
where the original descriptor in your input dataset would have been as follows:
10 | SS | monophasic | gr 3 | pelvis |
The (2) indicates that the case 106 entry in the combined dataset contains the
combined score derived from up to 2 replicate cores. This is also true for
antibodies - in the example above, if bcl2 had been combined from two different bcl2 scores,
the column header would appear as (2)bcl2.
Core and antibody replicates that occur only once in the aggregate dataset,
however, will appear in the combined output file unchanged, and they will not
have a preceding number in parenthesis. If you notice some antibody replicates
that unexpectedly remained uncombined, you may want to go back and double-check
to ensure that your files fulfill the file
format requirements.
The other major change you will notice is the format of the entries in the
UID column. Here, the jpg filenames corresponding to the three replicate cores
are present here, as well as all antibody names for which a score was available
in the uncombined dataset. The corresponding UID entry for the example case 10
is shown below:
1_19_1_4_14_1040_43.jpg*1_19_2_4_14_1040_42.jpg!10!cam5.2!pankeratin!ck7!ema!o13(cd99)!...
(not all of the UID entry is shown, for sake of brevity; the important section that has changed from the uncombined
dataset is shown above in red text)
The significance of the modifications in the formatting of the UID column
information will be covered in more detail in the
Stainfinder update section. For those of you who do not use Stainfinder,
you may safely disregard the information in this column.
Cluster and TreeView
For clustering analysis and visualization under TreeView, you may treat this
output file as you would with any other PCL-format output file generated by the
TMA-Deconvoluter. The combined datasets should not appear significantly different
from the uncombined data, save for the differences in the data deriving from the
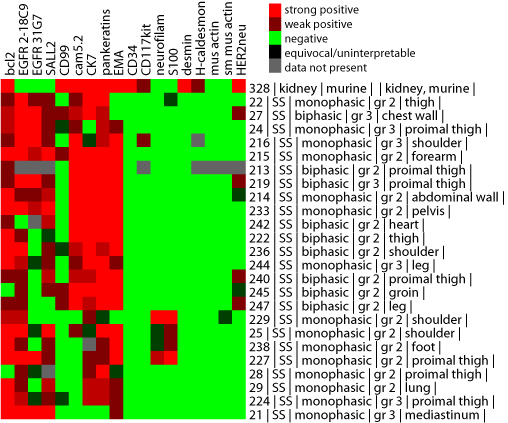
score combination process. There are two exceptions - one when Rule 2 score
combining is performed - in this case, you may notice additional, intermediate
color gradations between the colors shown in the standard score key, such as in
the example below. This is to be expected and should be interpreted at face value.

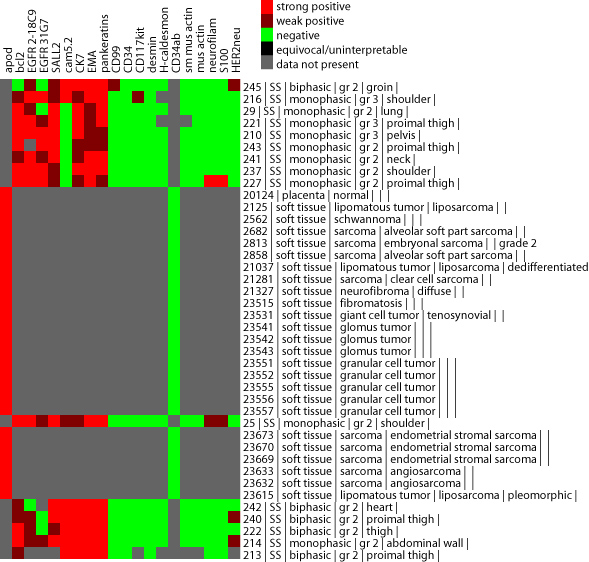
The other exception occurs when you combine multiple TMA datasets together
when there is very little overlap. Under such a situation, the heatmap in
TreeView will display large regions of gray, indicating the lack of overlap.
An example of this is shown below.

If you do not know how to use Cluster and TreeView, please refer to the
Deconvoluter Walkthrough - Step 3.
You may now browse your dataset for additional analysis. If you use Stainfinder
and wish to use it to view combined TMA datasets, proceed to the Stainfinder update
section, which begins on the next page.
back to top
Back to Step 3
Stainfinder - update section
Return to the walkthrough
overview page.
|

