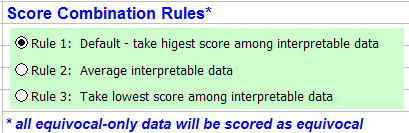
Selecting Score Combination Rules – Part 2
The Score Combination Rules appear in the TMA-Combiner as a number of
options, as shown below:
Note - in the examples shown in the tables below, the scoring system shown
is the discrete integer system we currently use. However, the cases as illustrated
below also apply to quantitative scoring systems. If n = minimum score, p = maximum
score, ni = intermediate negative score, pi = intermediate positive score, and u =
equivocal/uninterpretable score, setting -2 = n, -2 < ni < 0, 0 = u, 1 = pi, and 2 = p
in the tables below should yield the general case for a quantitative scoring system.
Rule 1 – take highest score among interpretable data.
This rule consists of taking the highest score among interpretable
data. It is set as the default rule because it corresponds to the
standard clinical practice of diagnostic IHC used for most antibodies.
Below is a table indicating a number of different possible cases, each
having four replicate cores. Each number shown is a "converted"
TreeView-compatible score, with its corresponding background color
matched to how it would appear in the TreeView heatmap.
| Rule 1 |
Score 1 |
Score 2 |
Score 3 |
Score 4 |
Combined
Score |
| Case 1 |
2 |
2 |
2 |
2 |
2 |
| Case 2 |
-2 |
-2 |
-2 |
2 |
2 |
| Case 3 |
-2 |
-2 |
1 |
-2 |
1 |
| Case 4 |
-2 |
0 |
-2 |
-2 |
-2 |
| Case 5 |
0 |
0 |
0 |
-2 |
-2 |
| Case 6 |
0 |
0 |
0 |
0 |
0 |
| Case 7 |
missing |
missing |
missing |
missing |
missing |
| Case 8 |
missing |
missing |
missing |
2 |
2 |
As one would expect with Case 1, combining four replicates with
identical scores results in the same score. This is also true for
Case 6 (which will be true for all three rules). Also true for all
three rules is Case 7, where missing data for all four replicates
results in a missing data score. Case 8 represents a very frequent
occurrence when replicate scores from multiple TMA datasets are
combined. This results when that particular replicate and antibody
stain is unique to one of the TMAs being combined.
In Cases 2 and 3, the effects of Rule 1 are clearly shown here,
where the high scores of 2 and 1, respectively, are used for the
combined score. One can also observe that, for Cases 4 and 5, the
equivocal scores are being eliminated from consideration before the
combined score is calculated - even though the equivocal score is
numerically higher than a negative stain score, the "highest" score
is still taken to be the negative stain score.
Rule 2 – average interpretable data.
This rule is more appropriate in cases where IHC staining is known
to be quantitative. Below is another table, here illustrating the
properties of Rule 2:
| Rule 2 |
Score 1 |
Score 2 |
Score 3 |
Score 4 |
Combined
Score |
| Case 1 |
2 |
2 |
2 |
2 |
2 |
| Case 2 |
-2 |
-2 |
-2 |
2 |
-1 |
| Case 3 |
-2 |
1 |
1 |
2 |
0.5 |
| Case 4 |
-2 |
0 |
1 |
1 |
0 |
| Case 5 |
2 |
0 |
0 |
-2 |
0 |
| Case 6 |
0 |
0 |
0 |
-2 |
-2 |
Here, in Cases 1-5, the scores are clearly the arithmetic mean
of the replicate scores. The biological interpretation can be
clearly different here than in Rule 1, particularly for Cases 4 and 5
- if a number of replicate cores taken from a given biopsy produce
an average score of 0, this would seem to suggest that the heterogeneity
in the scores of the sampled cores would make it difficult to interpret
the overall score of the biopsy as a whole. Case 6, here, illustrates
that the Rule 2 averaging will not count equivocal scores towards the
average (if it did, the combined score would be -0.5).
Rule 3 – take lowest score among interpretable data.
This rule consists of taking the lowest score among interpretable data.
This rule may seem counterintuitive at first, but its use becomes more
apparent when one considers IHC staining for antibodies and tissue
types that are susceptible to false positives or which only strong
positive staining correlates with a biologically significant outcome.
Below is a table illustrating properties of Rule 3:
| Rule 2 |
Score 1 |
Score 2 |
Score 3 |
Score 4 |
Combined
Score |
| Case 1 |
2 |
2 |
2 |
2 |
2 |
| Case 2 |
2 |
2 |
1 |
2 |
1 |
| Case 3 |
-2 |
2 |
2 |
2 |
-2 |
| Case 4 |
2 |
0 |
1 |
1 |
1 |
| Case 5 |
0 |
0 |
0 |
2 |
2 |
Note that only in Cases 1 and 5 is a strong positive score of 2
obtained; in Cases 2 and 3, the lowest replicate score is used to
represent the entire case. In Cases 4 and 5, the equivocal scores are
again not taken into consideration, even though it presents the numerically
lowest score in their respective cases.
Note: the current version of the TMA-Combiner can only apply
one score combination rule per processing run. If your TMA datasets to be
combined contain IHC stains that require different score combination rules
to be applied, you will need to separate your TMA datasets accordingly and
process each one separately.
Other Combination Options
Lastly, there are some score combination options as shown below:

By default, both rows (core replicates) and columns (antibody stains)
are selected. However, if desired, it is possible to combine only the
rows or only the columns. If you try to deselect both options, however,
the TMA-Combiner will catch this and abort the run.
Scores can also be rounded after each combining. This applies only if
both the combine columns and the combine rows options are checked. The
combination order is rows, then columns. Score rounding only matters in
the case of Rule 2, and rounding is performed to the nearest integer.
Since TreeView can handle non-integral values, this option is unselected
by default but is available for users may desire to use this feature.
Run the TMA-Combiner

You are now ready to run the TMA-Combiner. Click on the
button as shown above (in Excel, not here on this web page).
back to top
Back to Step 2
Step 4 - The Output File
Return to the walkthrough
overview page.
|