Inigo Espinosa, Andrew H Beck, Cheng-Han Lee, Shirley Zhu, Kelli Montgomery, Robert J Marinelli, Kirsten N Ganjoo, Torsten O Nielsen, C Blake Gilks, Robert B West and Matt van de Rijn
American Journal of Pathology, doi:10.2353/ajpath.2009.081037
doi:10.2353/ajpath.2009.081037
| Home |
|
Home |
| LMS CSF1 Images |
|
View the LMS CSF1 tissue array images |
| LMS CSF1 Figures |
|
View supplemental figures for LMS CSF1 |
| WebPortal |
|
Stanford Tissue Microarray Consortium Web Portal |
| Authors |
|
Authors |
| Figures | ||
|
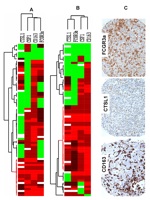
Figure 1: Figure 1. Gene expression profiling of 59 tumors with 72 CSF1-related genes. LMS, leiomyosarcomas; GIST, gastrointestinal stromal tumors; DFSP, dermatofibrosarcoma protuberans; DTF, desmoid-type fibromatosis; SFT, solitary fibrous tumor; SS, synovial sarcomas. Asterisks identify the markers selected for immunohistochemistry and in situ hybridization. Green indicates relatively low expression level, red indicates a relatively high level of expression, gray denotes missing data. | ||
| Figure 1 available as a PNG file (click on image for full size) | |
|
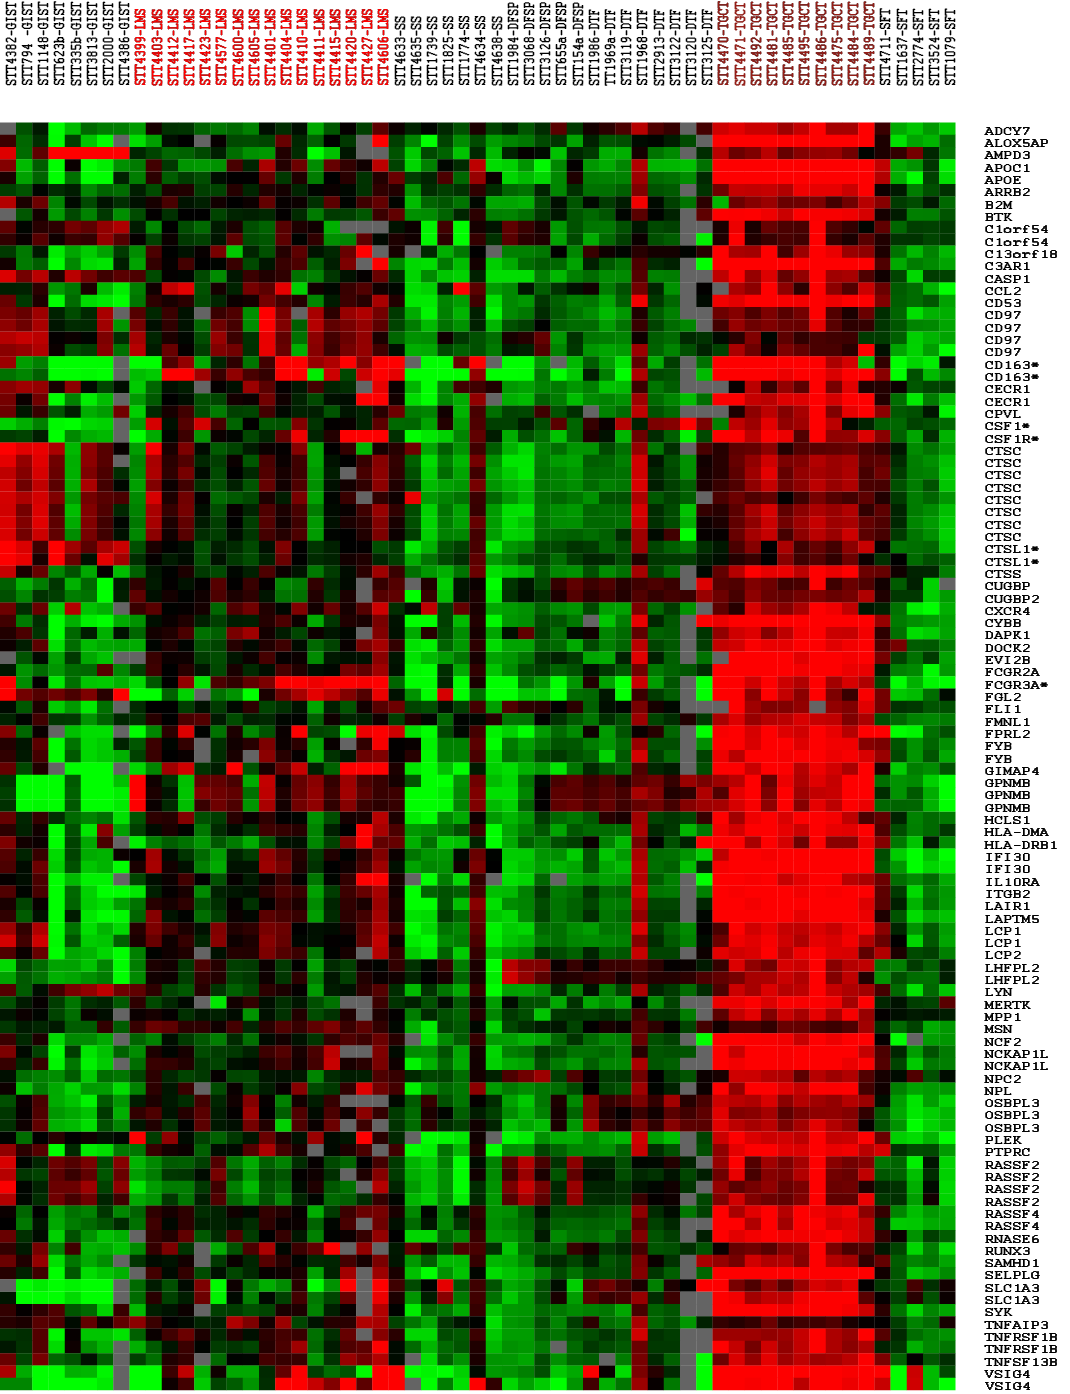
Figure 2: Figure 2. A–D: CD163 immunohistochemistry (purple) and CSF1 in situ hybridization (brown) double staining in four different LMS cases. The tumor cells characterized by pleomorphic nuclei express multiple brown dots (CSF1 mRNA). Instead, the majority of the CD163-positive macrophages (purple) do not show CSF1 expression. E and F: CSF1R staining in two different LMS cases. The expression of CSF1R mRNA (brown dots) was seen in macrophages (short arrows), and tumor cells (long arrows). Original magnifications, X60. | ||
| Figure 2 available as a JPG file (click on image for full size) | |
|
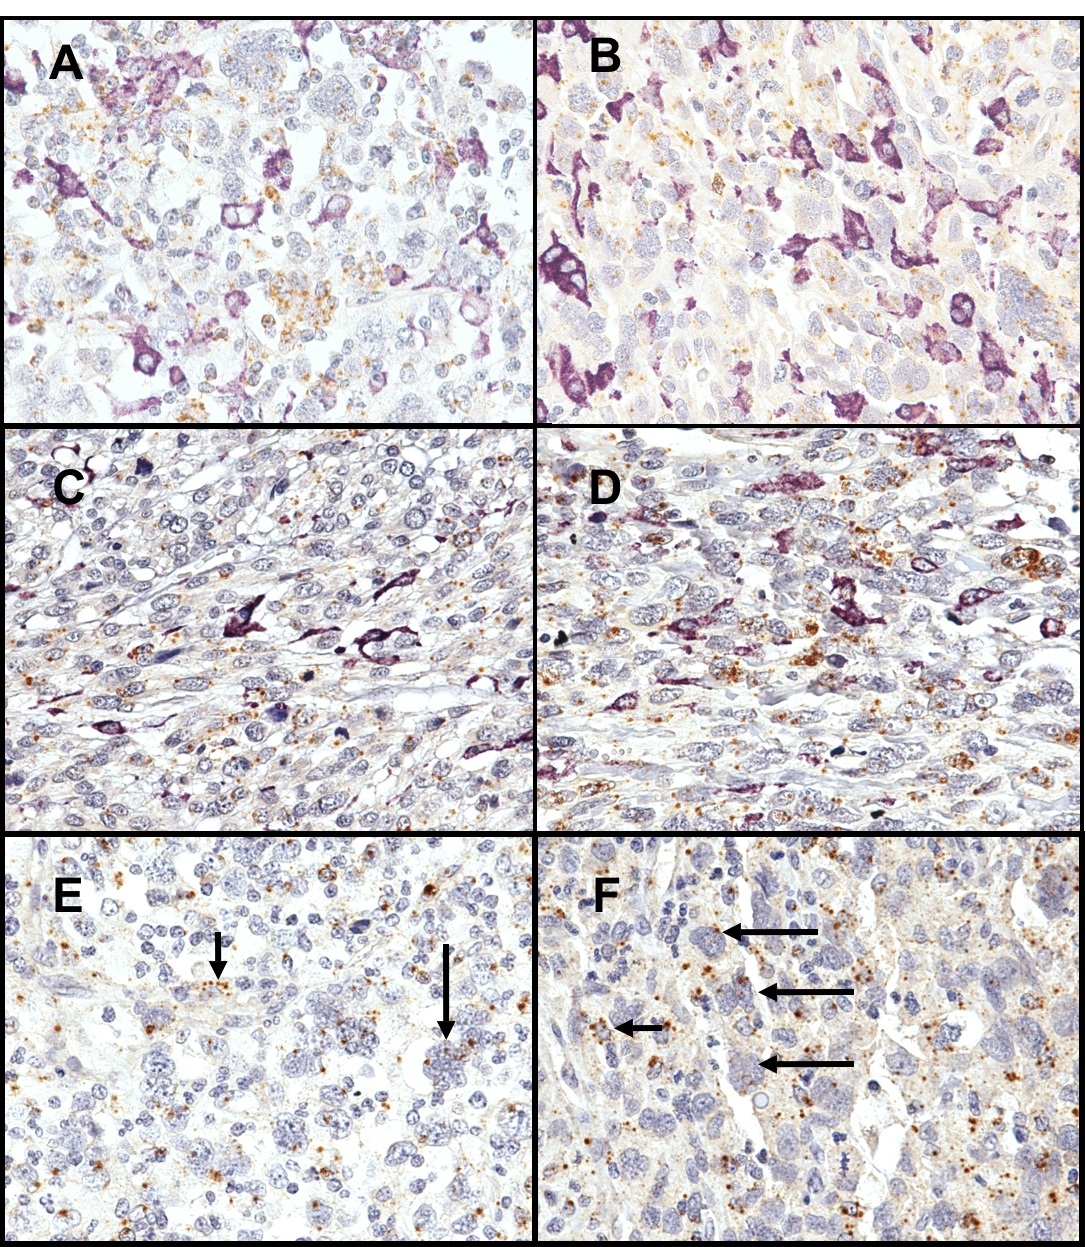
Figure 3: Figure 3. Hierarchical cluster analysis of immunohistochemistry for FCGR3a, CTSL1, CD163, and in situ hybridization for CSF1 in the gynecological (A) and nongynecological (B) LMS. Each column represents a different tumor and each row a different marker. The red segment of the dendrogram indicates a group of cases positive for all markers with interpretable data. C: Stain of a representative case with CD16 3, CTSL1, and FCGR3a immunohistochemical markers. Green, score 0; black, score1; brown, score 2; red, score 3; and white, missing data. | ||
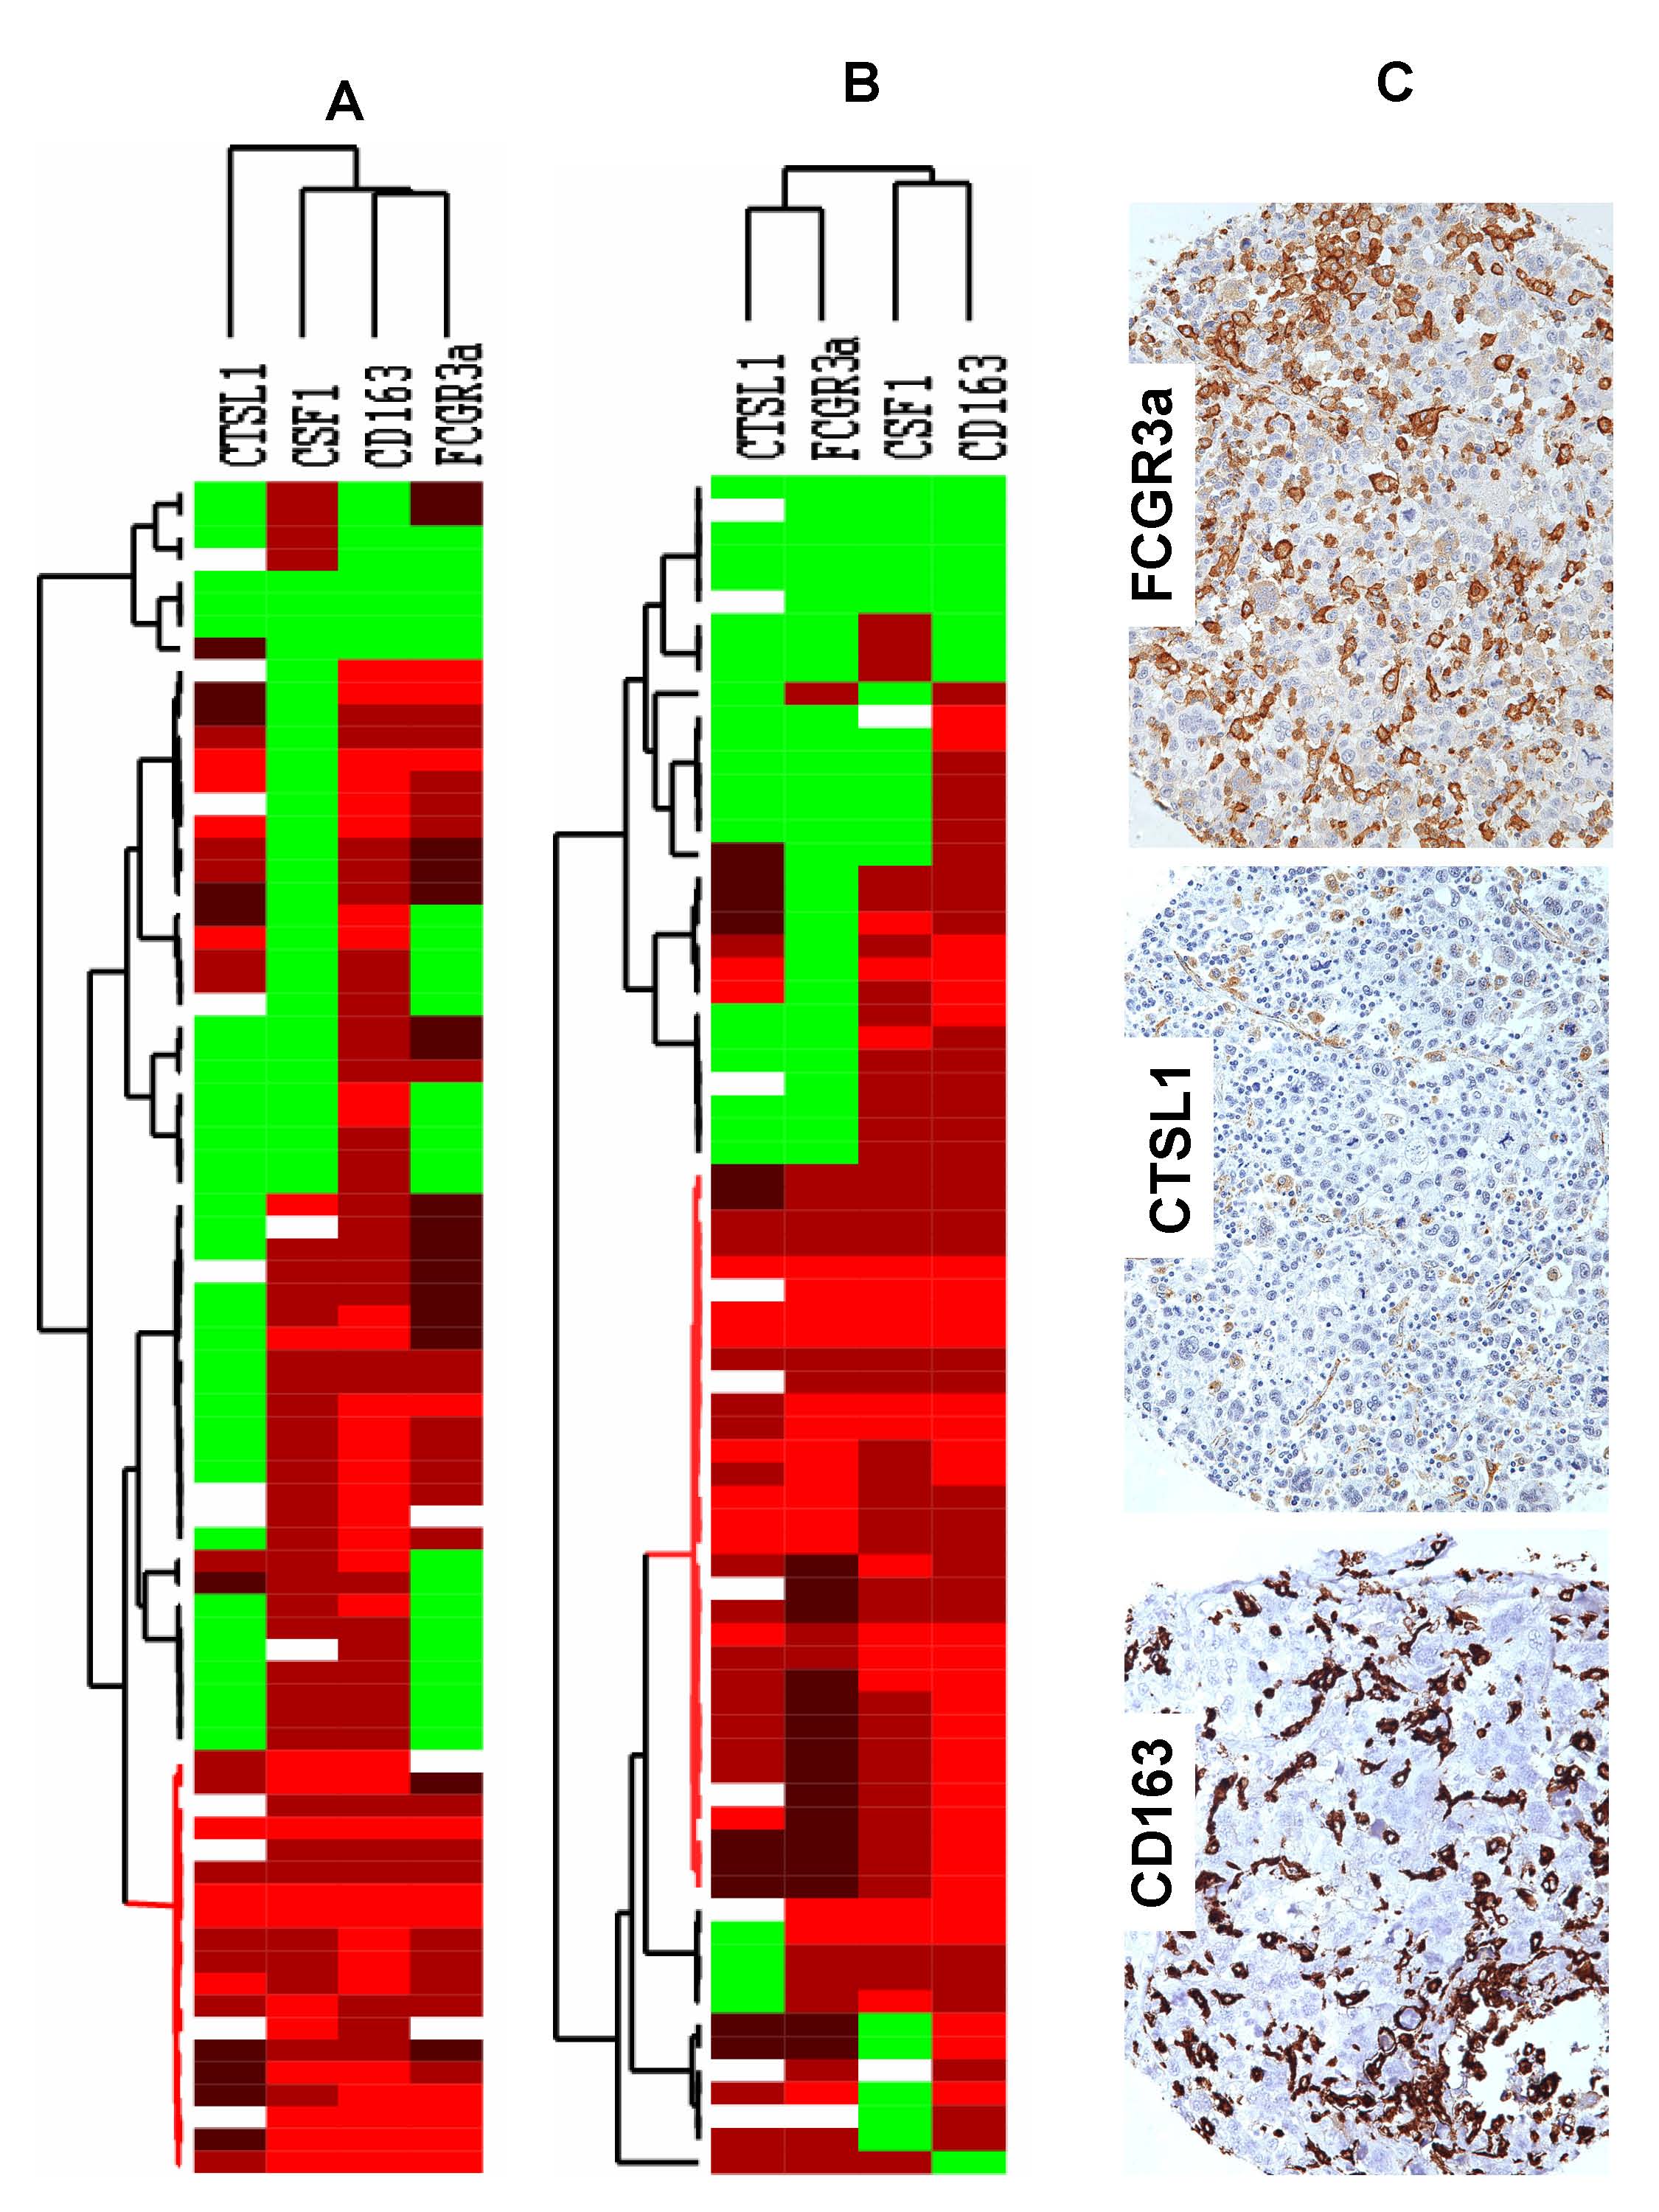
| Figure 3 available as a JPG file (click on image for full size) | |
|
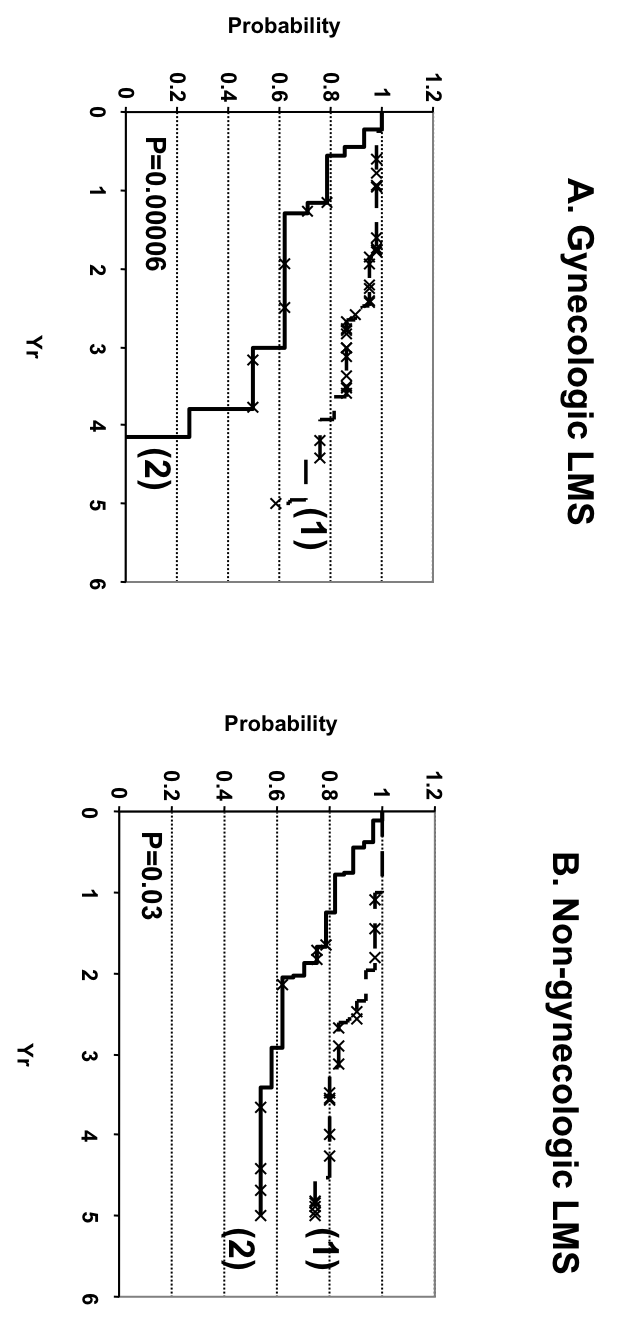
Figure 4: Figure 4. Kaplan-Meier analysis for those LMS cases that had interpretable stain for all four markers (FCGR3a, CTSL1, CSF1, and CD163) in the gynecological (A) and nongynecological (B) LMS. 1: LMS with negative stain for one or more markers. 2: LMS-positive for all four markers. | ||
| Figure 4 available as a PNG file (click on image for full size) | |
|
Supplemental Figure 1: Unsupervised hierarchical clustering of 59 Soft Tissue Tumors and 459 CSF1 response genes. Both genes and cases were clustered using correlation as a distance metric and average linkage clustering. Within the heatmap, green indicates relatively low expression, red indicates relatively high expression, and grey denotes missing data. The colorbar to the right of the heatmap shows yellow for core CSF1 response genes and blue for non-core CSF1 response genes. The 4 core CSF1 response genes which were analyzed by ISH or IHC on an LMS tissue microarray are indicated on the right-most colorbar in orange. The diagnostic subtype of each case is indicated by its label and font color: LMS (red): leiomyosarcoma with CSF1 response signature, LMS (green): leiomyosarcoma without CSF1 response signature, GIST (blue): gastrointestinal stromal tumors; DFSP (light blue): dermatofibrosarcoma protuberans, DTF (gold): desmoid-type fibromatosis, SFT (orange): solitary fibrous tumor, SS (purple): synovial sarcomas, TGCT (black): tenosynovial giant cell tumors. | ||
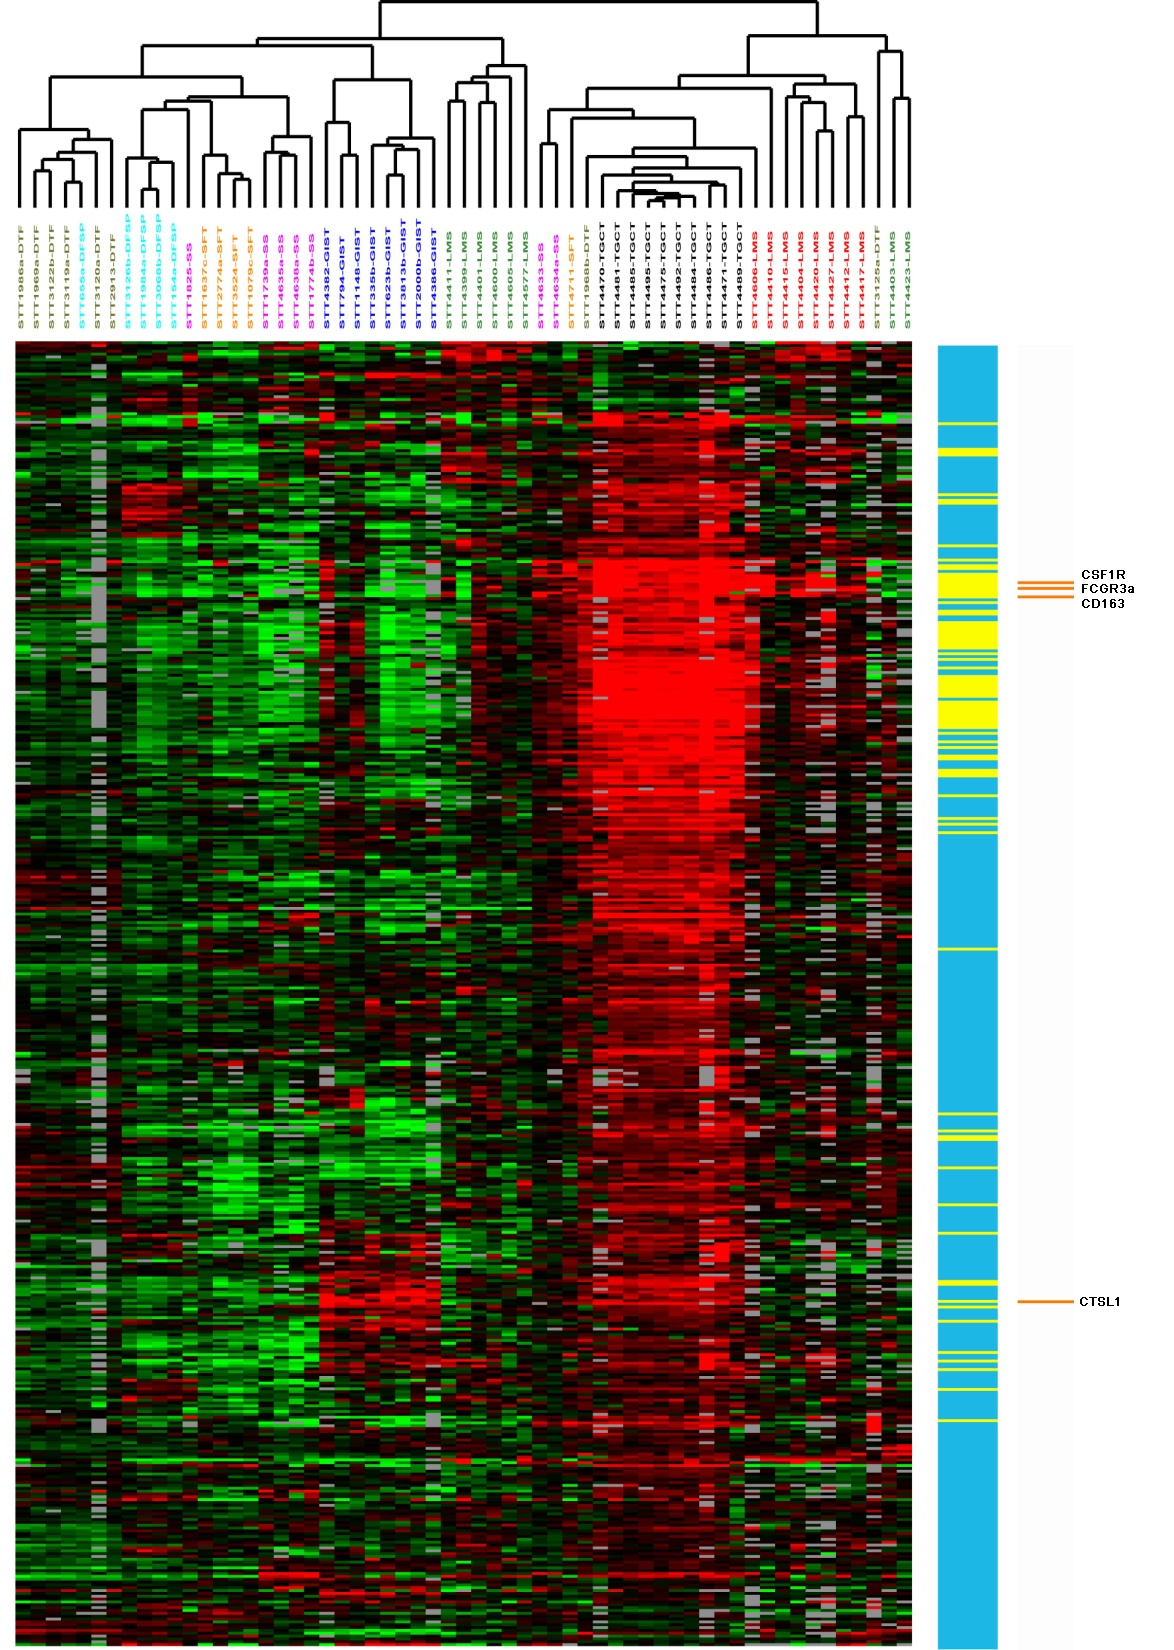
| Supplementary Figure 1 available as a PNG file | |
|
Supplemental Figure 2: CD163, FCGR3a, CD56, and CD57 stains in a LMS case (92P). The CD163 and FCGR3a positive macrophages do not express CD56 and CD57. | ||
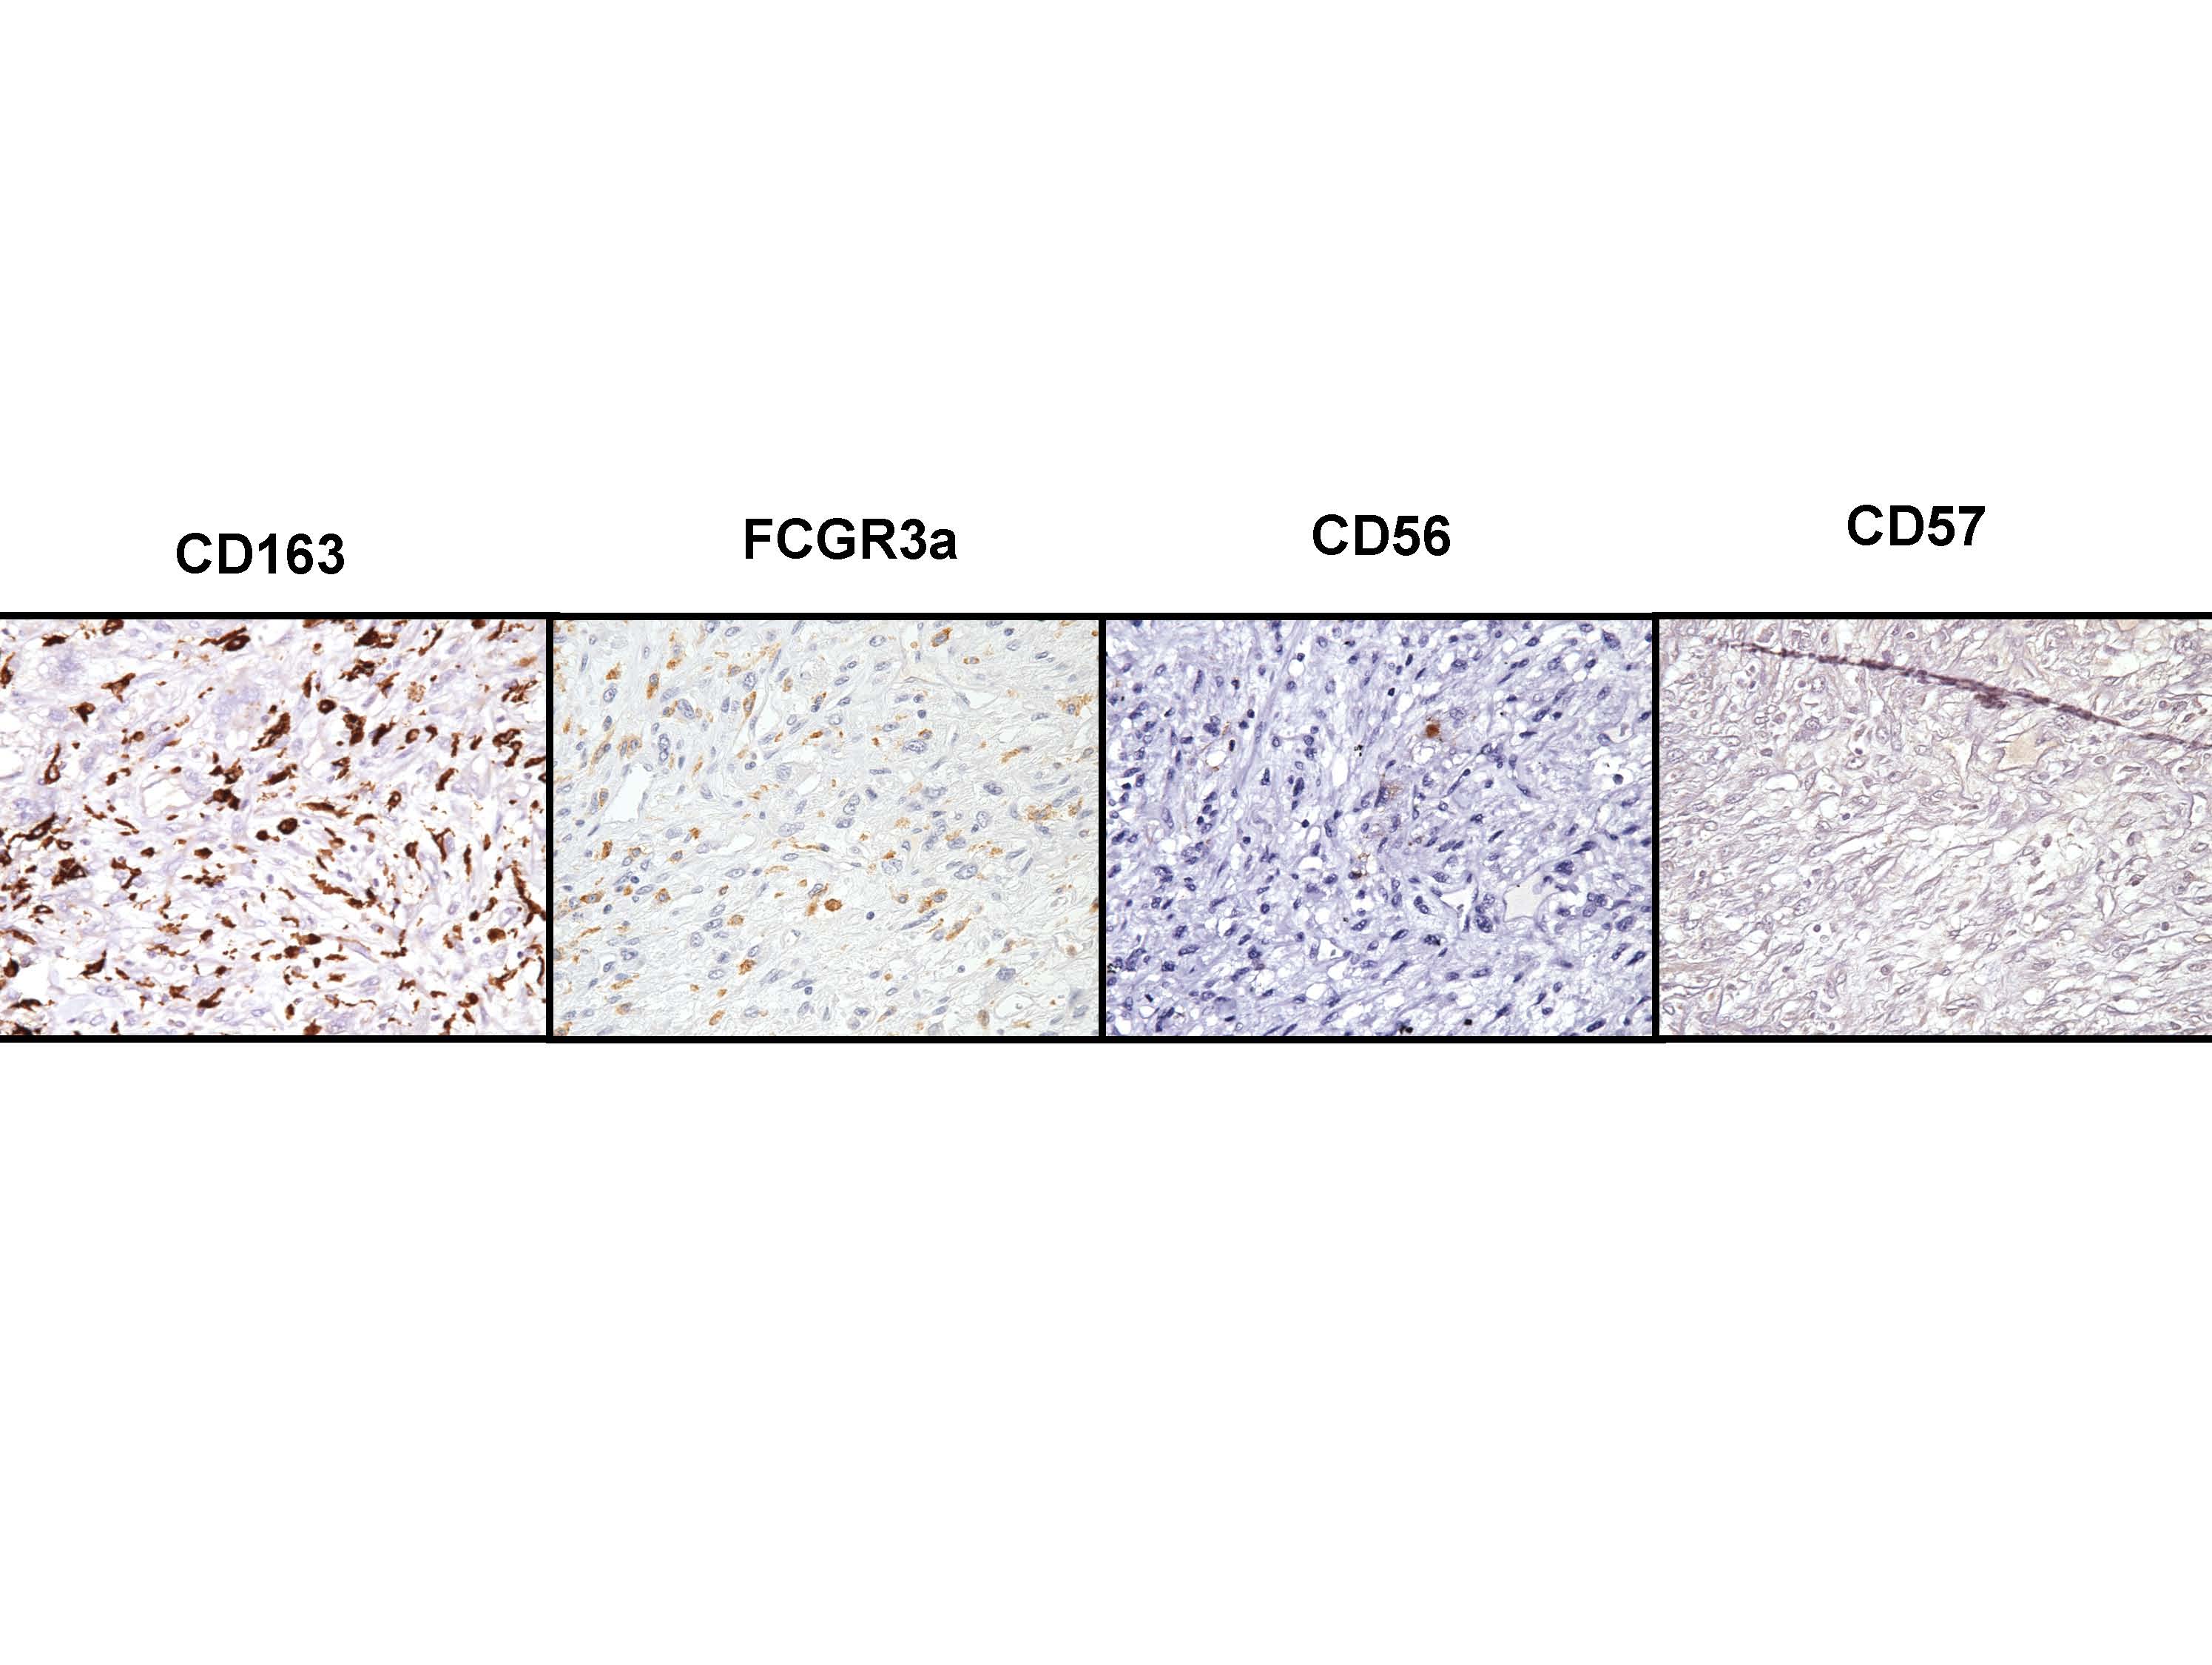
| Supplementary Figure 2 available as a JPEG file | |
|
Supplemental Figure 3: Kaplan Meier analysis for FCGR3a, CTSL1, CSF1, and CD163 in the gynecologic and non-gynecologic LMS. The Bonferroni shows that for 6 comparisons the p value for each one should be < 0.008 to have an overall alpha error level (p value) of 0.05. | ||
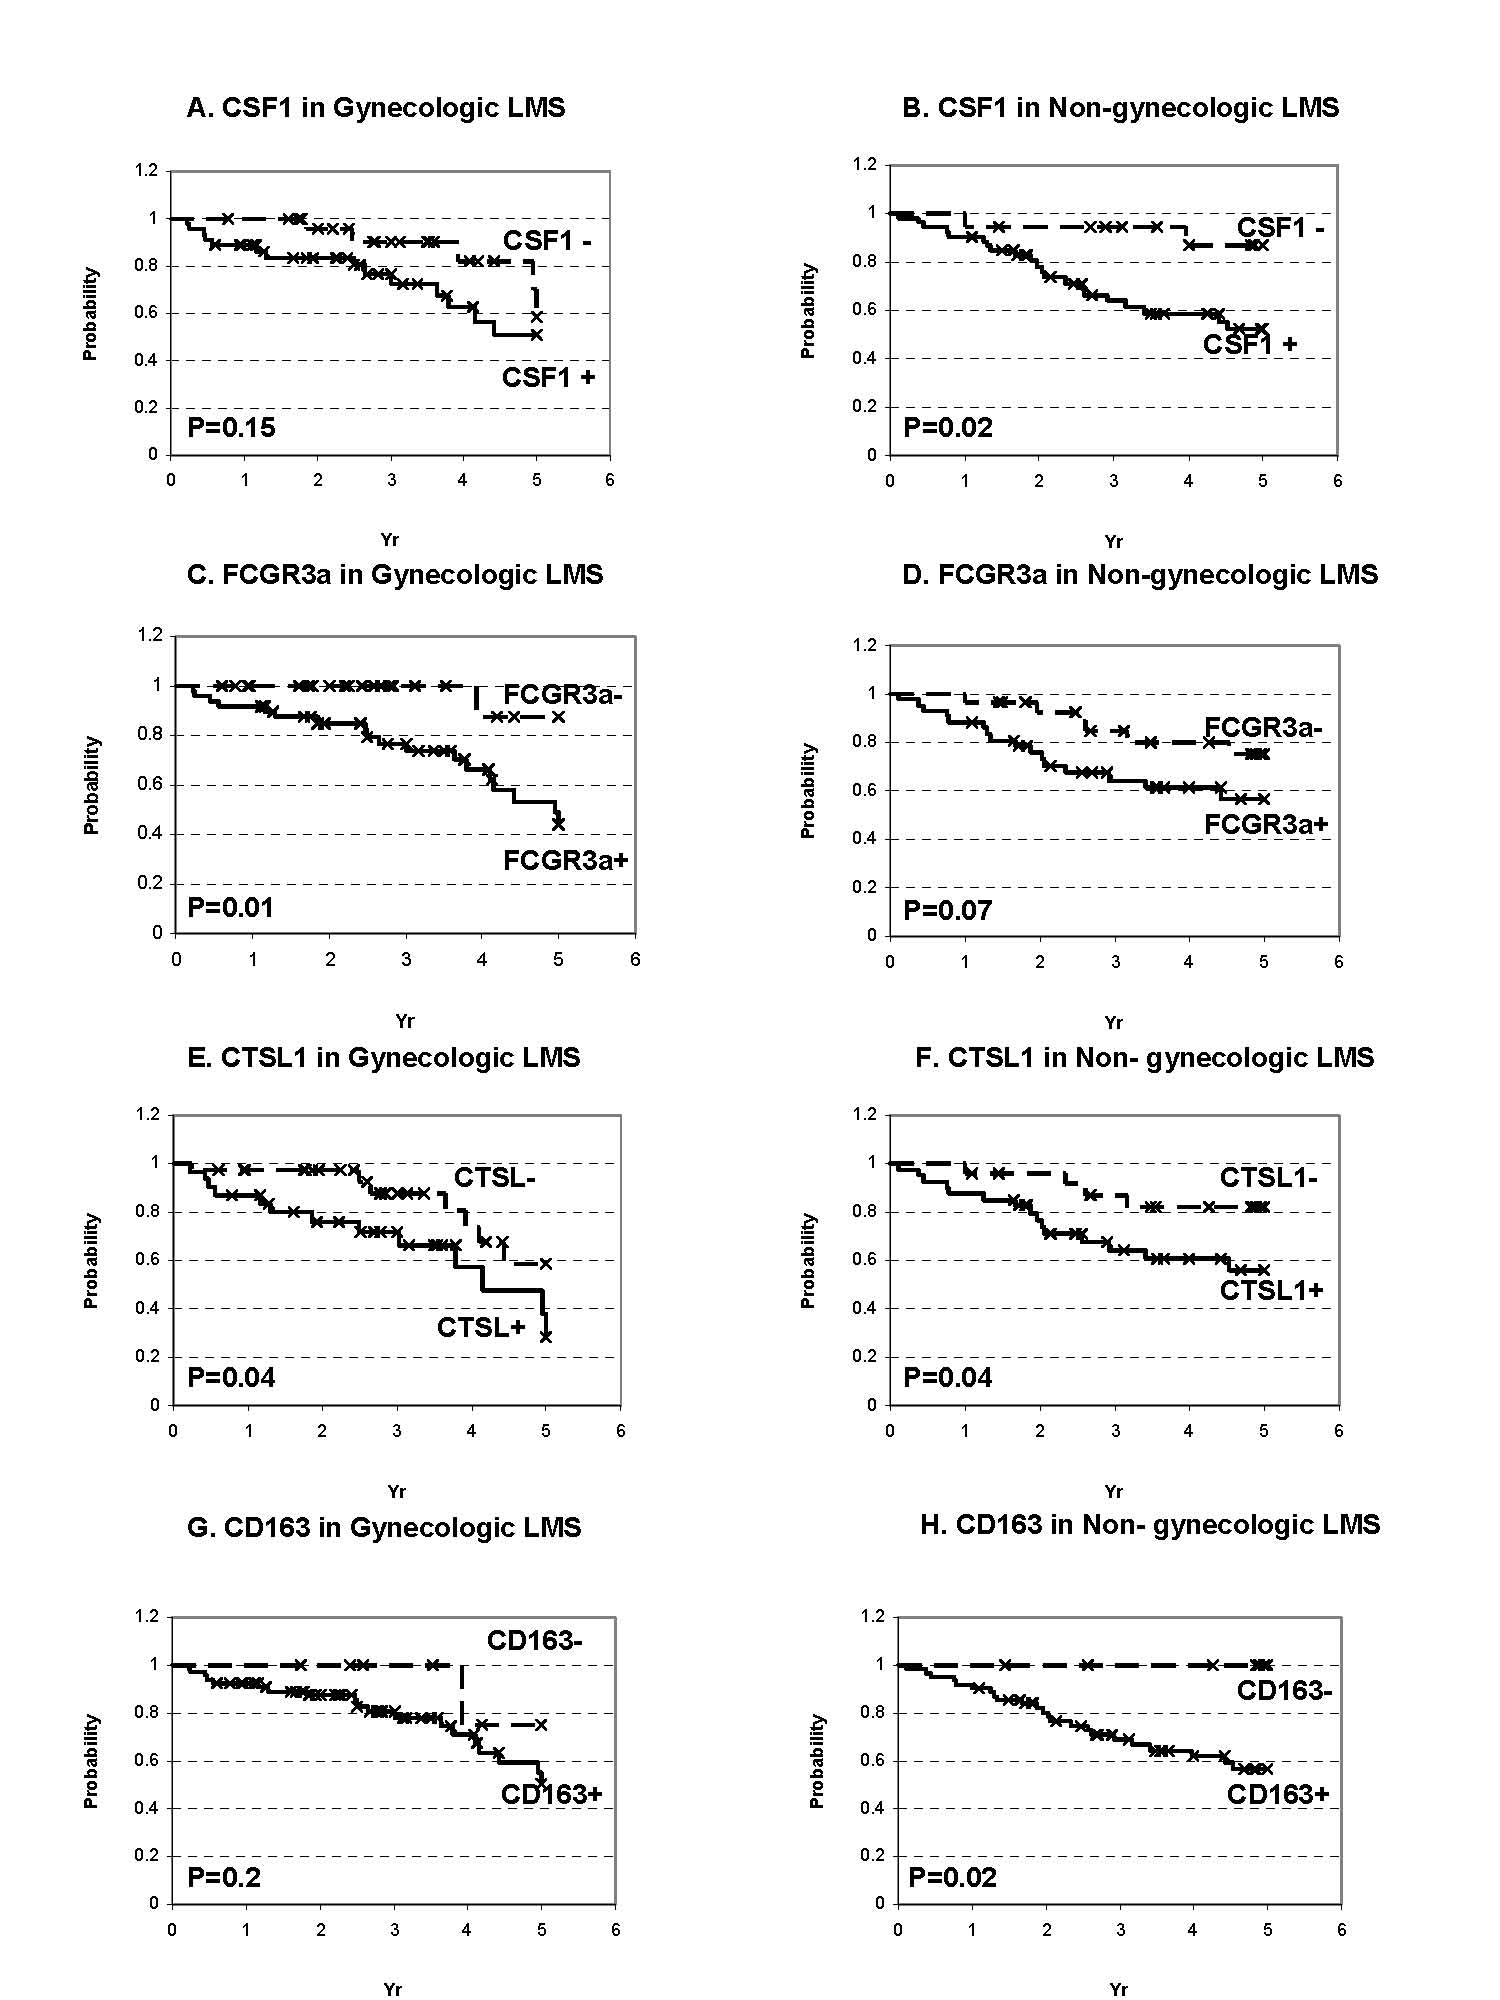
| Supplementary Figure 3 available as a JPEG file | |
|
|
||
|
|
||