Home
DTF_SFTbreast Homepage
Materials
Materials and Methods
GeneX
Explore the raw data
Figures
Tables and Figures
Authors
Contributing authors
Figures
Below are a list of figures and tables from the paper and supplement figures. We have made the figures available in both JPG and PDF formats, to facilitate online viewing.
Figures from paper: Tables from paper:
Figure 1
Table 1
Figure 2
Table 2
Figure 3
Supplemental Table 1
Figure 4
Supplemental Table 2
Figure 5
Supplemental Table 3
Figure 6
Supplemental Table 4
Supplemental Figure 1
Supplemental Figure 2
Supplemental Figure 3
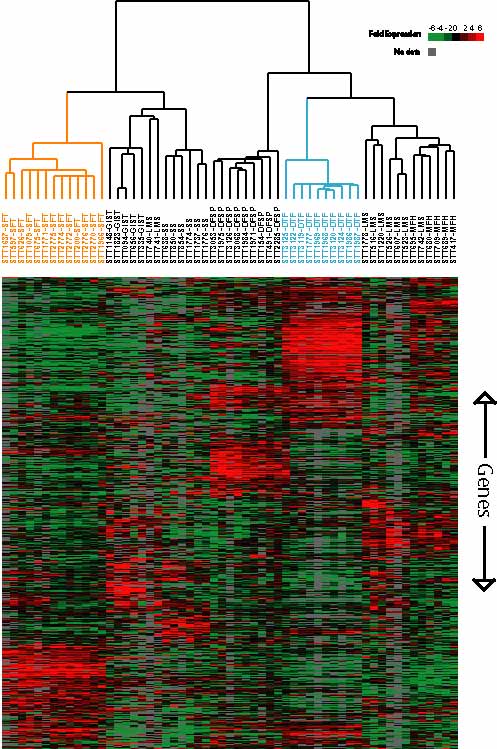
Figure 1:
Soft tissue tumor gene expression of 10 cases of DTF (blue), 13 cases of SFT (orange), and 35 other previously examined soft tissue tumors (black) based expression profiling on 42,000 -element cDNA microarrays.
Available both as:
JPG Document
Portable Document Format
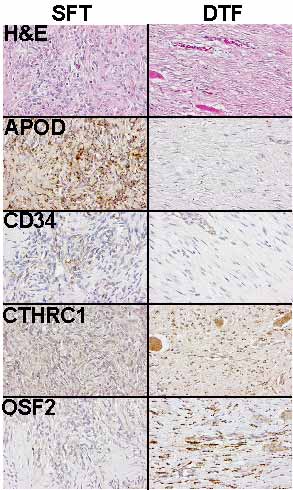
Figure 2:
Localization of fibroblastic gene expression. Comparison of expression of 2 SFT markers ApoD (ISH) and CD34 (IHC), and 2 DTF markes CTHRC1 (ISH) and OSF2 (ISH) in SFT and DTF.
Available both as:
JPG Document
Portable Document Format
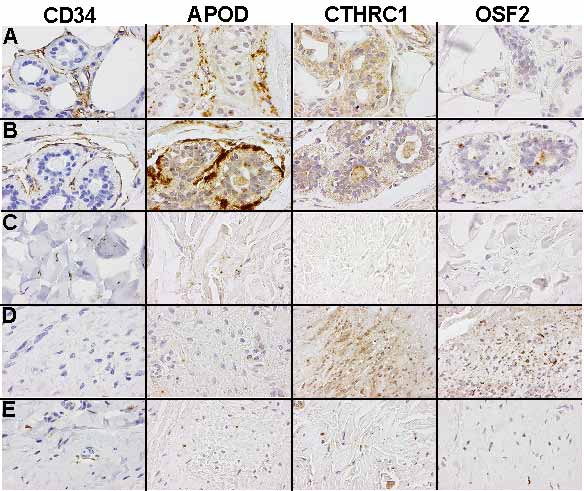
Figure 3:
Fibroblastic markers in non-neoplastic tissue: A. skin adnexa, B. breast, C. dermis, D. reactive, and E. keloid tissue arranged in rows. Fibroblastic markers: CD34 (IHC), APOD (ISH), CTHRC1 (ISH) and OSF2 (ISH) arranged in columns. SFT express APOD and CD34 while DTF express CTHRC1 and OSF2. Magnification = 600x. A figure with lower magnifications is available as Supplemental Web Figure 3.
Available both as:
JPG Document
Portable Document Format
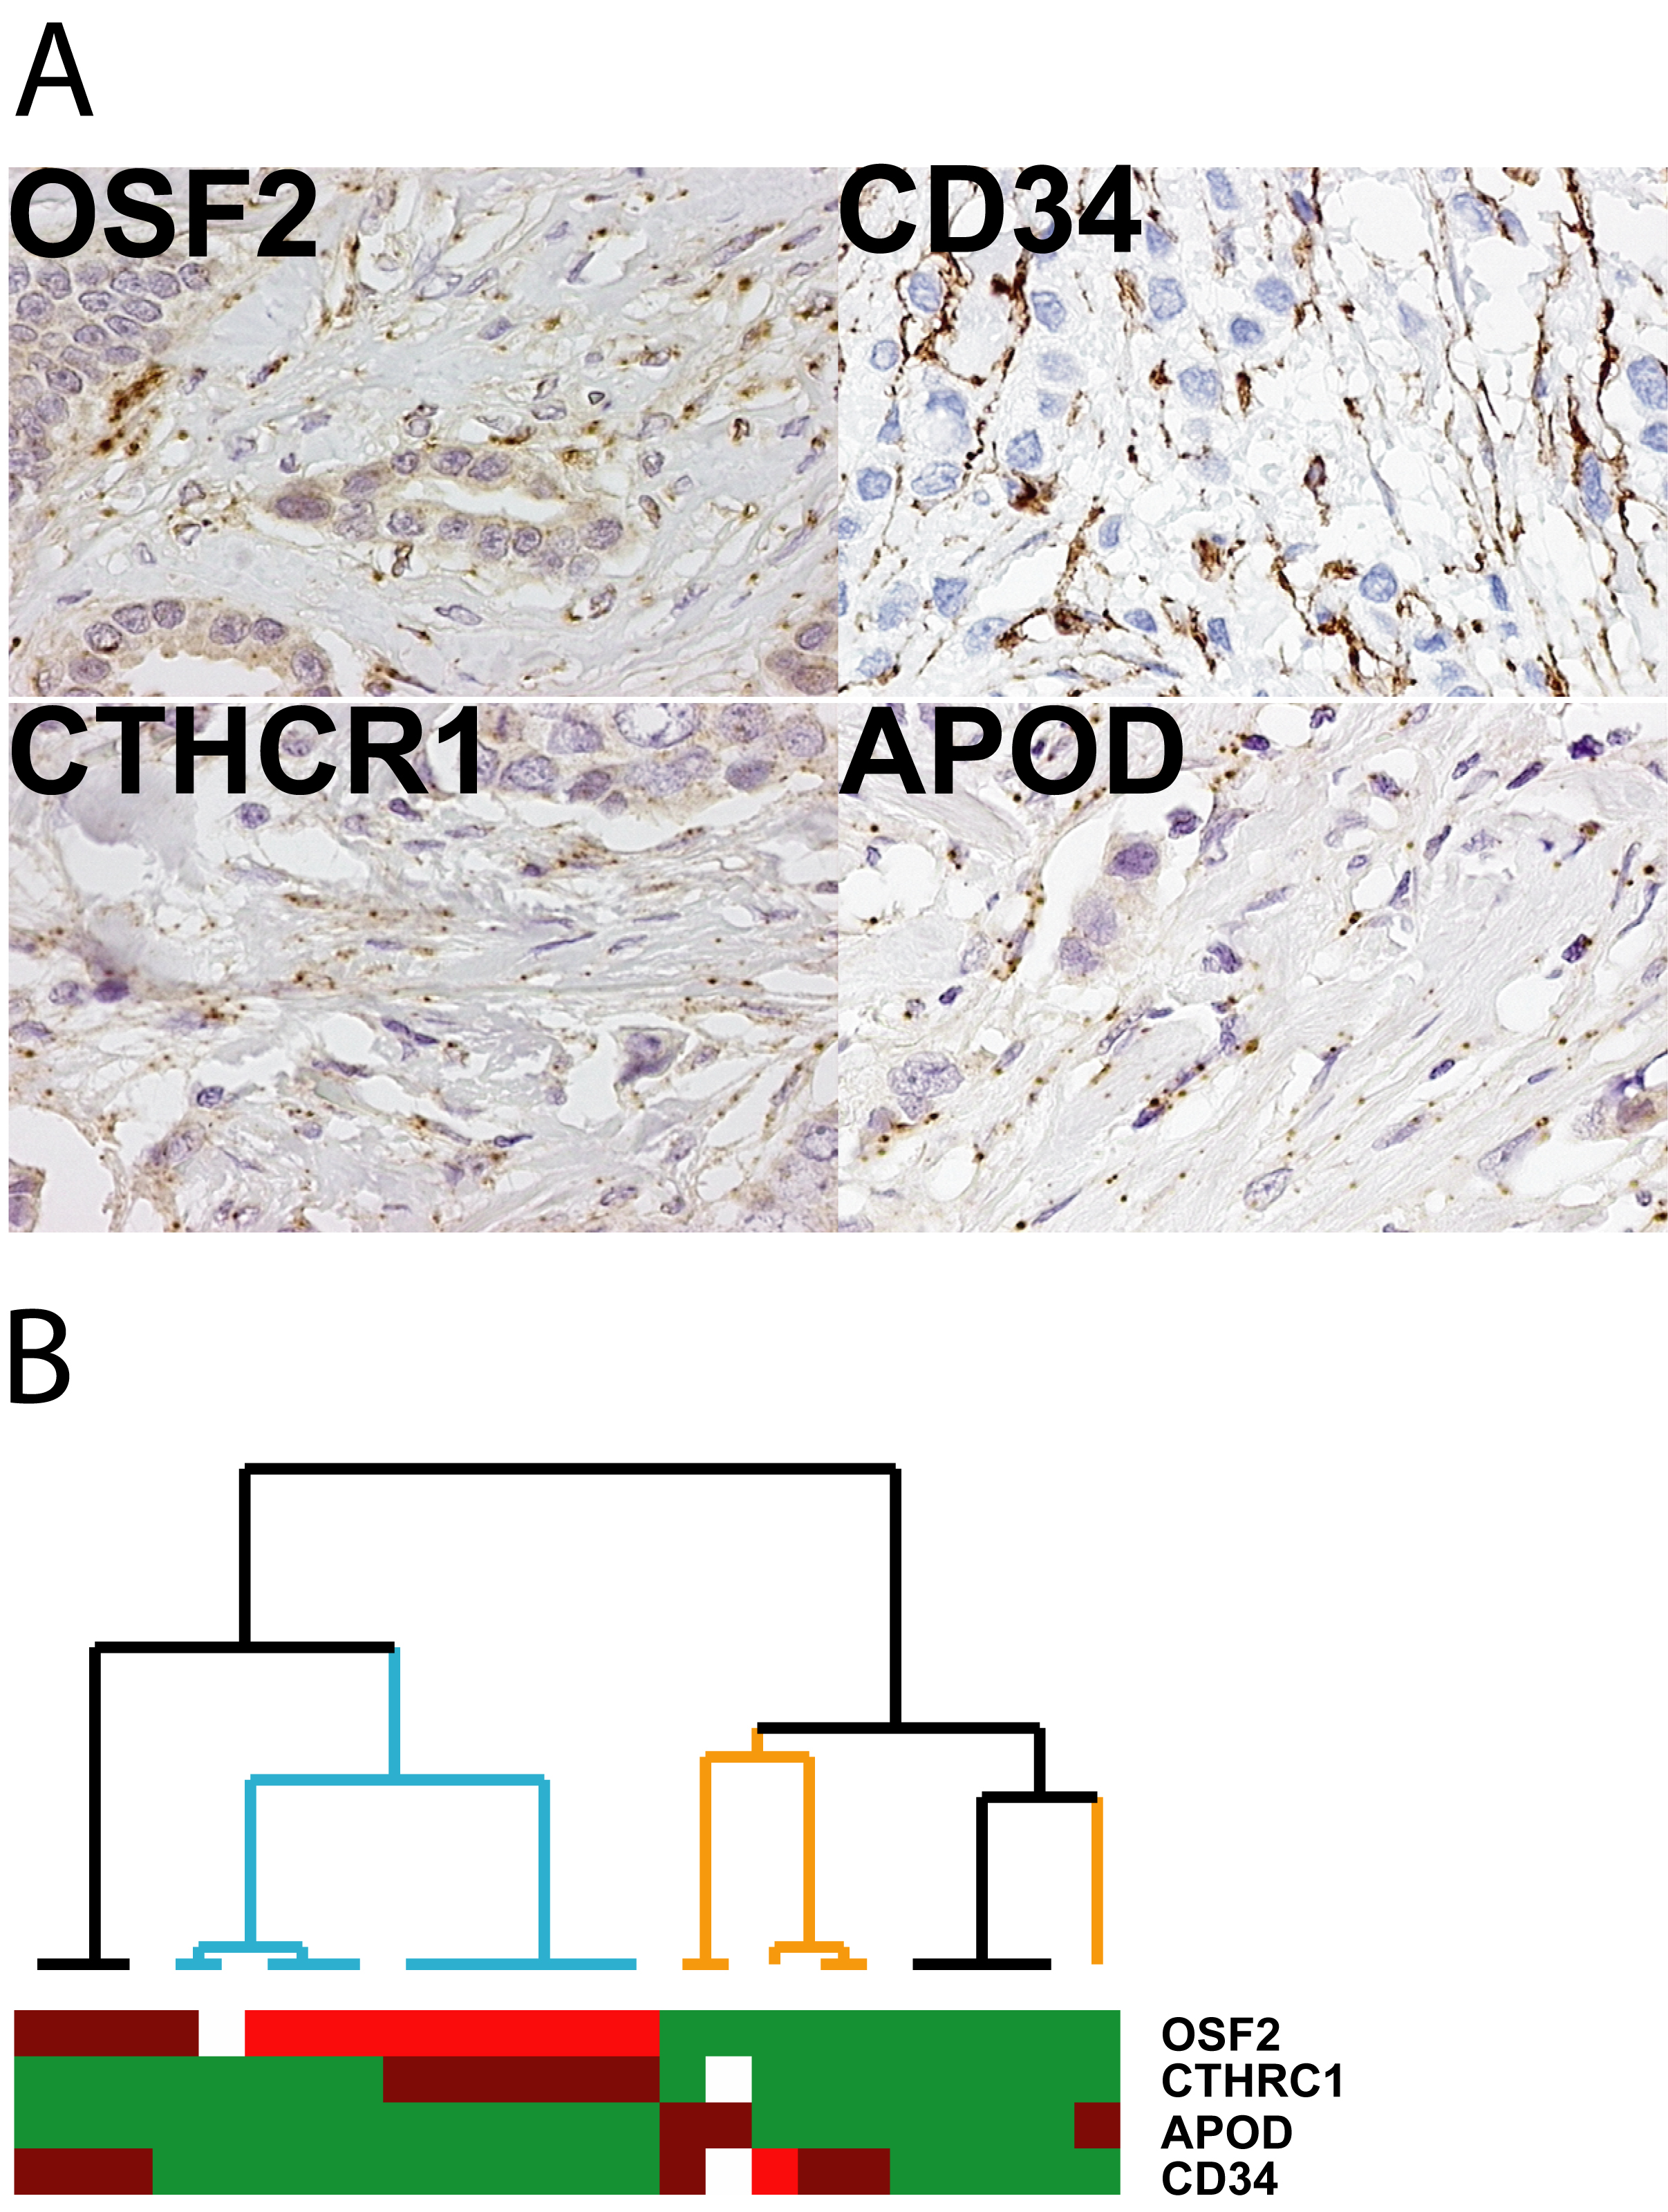
Figure 4:
Fibroblast markers in breast carcinoma. A) Examples of SFT (ApoD (ISH) and CD34 (IHC)) and DTF (CTHRC1 (ISH) and OSF2 (ISH)) expression in breast carcinoma stroma. B) Hierarchical clustering of 24 breast carcinomas based on tissue microarray staining with fibroblast markers: CD34 (IHC), ApoD (ISH), CTHRC1 (ISH) and OSF2 (ISH).
Available both as:
JPG Document
Portable Document Format
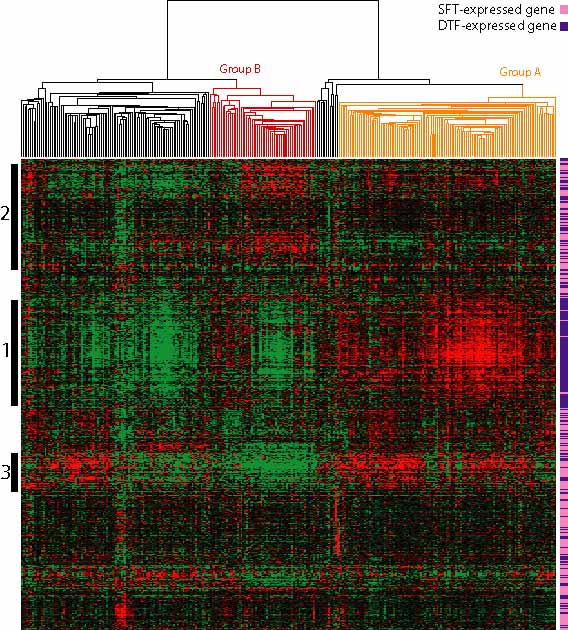
Figure 5:
Hierarchical clustering of 295 breast carcinomas.
Available both as:
JPG Document
Portable Document Format
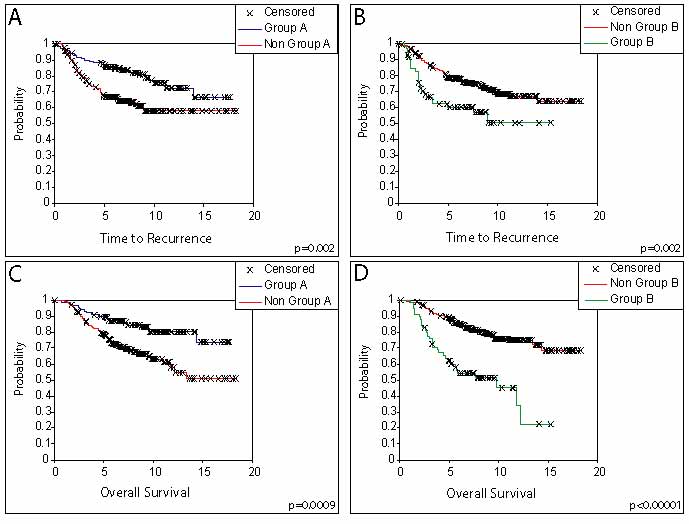
Figure 6:
Outcome data. A) Time to first recurrence for Tumor group A versus all other tumors. B) Time to first recurrence for Tumor group B versus all other tumors. C) Survival outcome for Tumor group A versus all others. D) Survival outcome for Tumor group B versus all others.
Available both as:
JPG Document
Portable Document Format
Table 1:
Selected genes in A) DTF and B) SFT.
Available as:
Word Document
Table 2:
Multivariate analysis for tumor group status versus clinical risk factors including treatment with chemotherapy, tumor size (< 2cm), lymph node status, tumor grade (low and intermediate versus high), age (<40 years old), vascular density.
Available as:
Word Document
Supplemental Table 1:
Significance Analysis of Microarray (SAM). SFT and DTF are analyzed with a false discovery rate of 0.1%.
Available both as:
HTML Document
Excel File
Supplemental Table 2:
Clinical information for DTF and SFT cases
Available both as:
HTML Document
Excel File
Supplemental Table 3:
Clinical data on the 295 breast carcinoma case set from The Netherlands Cancer Institute.
Available both as:
HTML Document
Excel File
Supplemental Table 4:
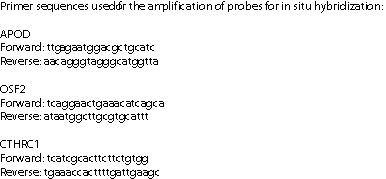
Primer sequences used for the amplification of probes for in situ hybridization.
Available both as:
JPG Document
Excel File
Supplemental Figure 1:
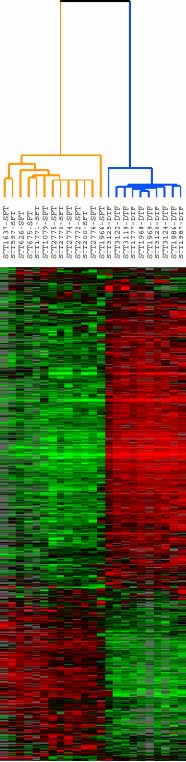
Soft Tissue Tumor Gene Expression of Ten Cases of DTF (blue) and Thirteen Cases of SFT (orange), Based on Expression Profiling on 42,000 Element cDNA Microarrays.
Available both as:
JPG Document
Portable Document File
Supplemental Figure 2:
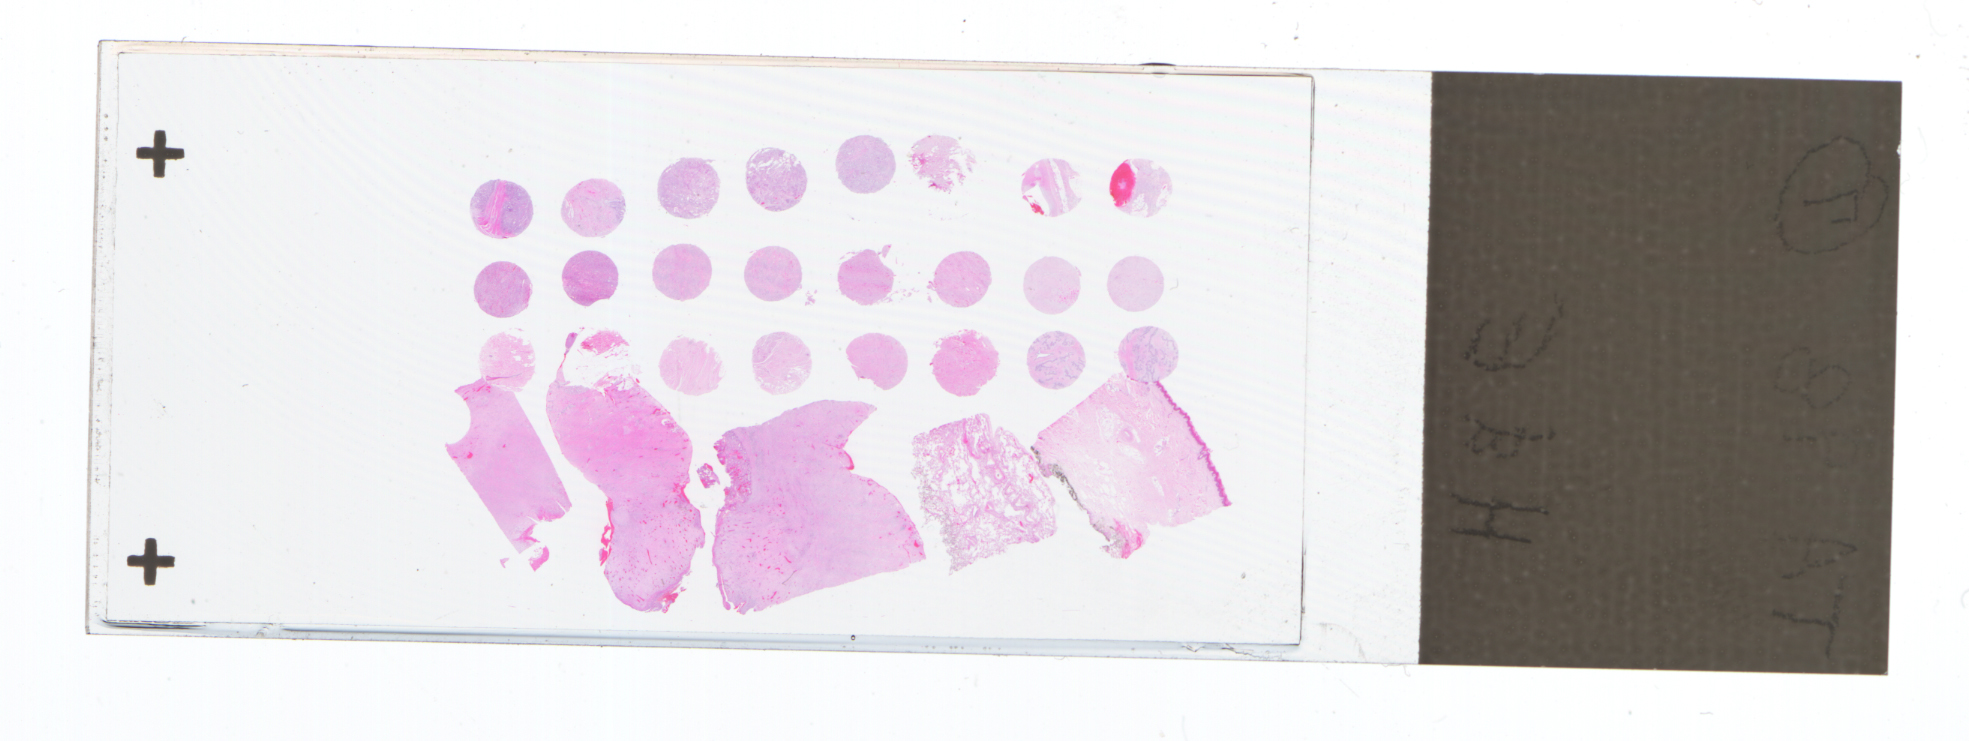
The oriented fragments of tissue are show at the bottom of the figure; the cores are shown at the top.
Available both as:
JPG Document
Portable Document File
Supplemental Figure 3:
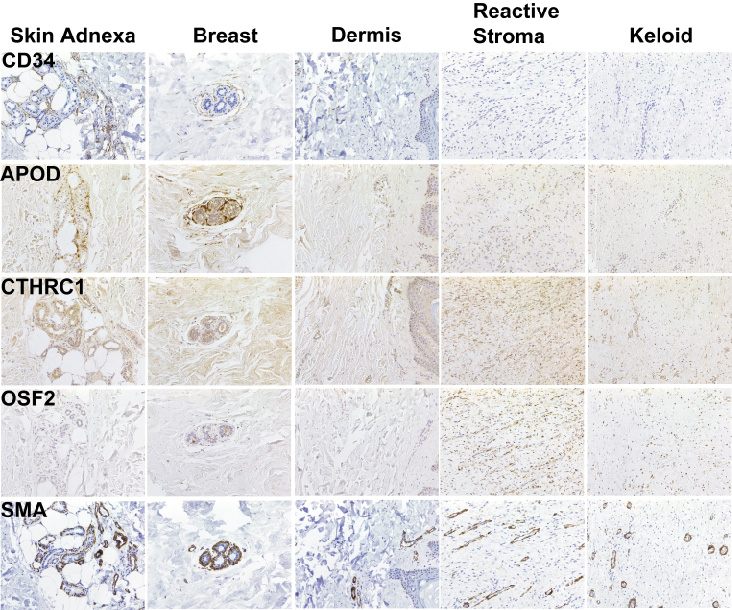
Fibroblastic markers in non-neoplastic tissue: skin adnexa, breast, dermis, reactive, and keloid tissue arranged in columns. Fibroblastic markers: CD34 (IHC), APOD (ISH), CTHRC1 (ISH) and OSF2 (ISH) arranged in rows. SFT express APOD and CD34 while DTF express CTHRC1 and OSF2. Smooth muscle actin (SMA) immunohistochemistry is included for comparison. Magnification = 300x.
Available both as:
JPG Document
Portable Document File
[
Home
|
Materials
|
GeneX
|
Figures
|
Authors
]