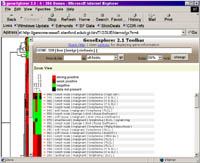
 GeneExplorer ( Rees, et al. (2004)) is a web application that allows the exploration of large bodies of gene expression data generated by DNA microarray experiments using a web browser as its interface. GeneExplorer ( Rees, et al. (2004)) is a web application that allows the exploration of large bodies of gene expression data generated by DNA microarray experiments using a web browser as its interface.
The DTF_STF datasets
A hierarchical clustering algorithm (Eisen et al. (1998)) was used to
group genes based on similarity in the pattern with which their
expression varied over all samples. To visualize the results, the
expression level of each core sample was represented by a color, with
bright yellow representing a positive staining result, dark yellow
representing a weak positive staining result, blue representing a
negative staining result, and grey representing uninterpretable or missing data.
A "bird's eye view" of the data is displayed in a "thumbnail" or "Radar" pane on the left, and a blown up view in the "Zoom" pane on the right. The "Radar" gives an overview of the general patterns observable in the expression data after it has been submitted to a clustering procedure.
By clicking on a region of interest in the "Radar" view, a regional enlargement will be displayed in the "Zoom" view. Here an identifier for each tissue core sample is visible. Each row includes a link to retrieve the actual image of the core sample for all antibodies in the dataset used to stain the core sample.
Figure 1. Soft tissue
tumor gene expression of 10 cases of
DTF (blue), 13 cases of SFT (orange),
and 35 other previously examined soft
tissue tumors (black) based
expression profiling on 42,000
-element cDNA microarrays.
Click
here for the
blue/yellow version of
Treeview GeneXplorer Figure 1
Click
here for the
red/green version of
Treeview GeneXplorer Figure 1
Raw data are available via the Stanford Microarray Database
Supplemental Figure 1. Soft Tissue Tumor Gene Expression of Ten Cases of DTF (blue) and Thirteen Cases of SFT (orange), Based on Expression Profiling on 42,000 Element cDNA Microarrays.
Click here for the blue/yellow version of
Treeview GeneXplorer Supp Figure 1
Click here for the red/green version of
Treeview GeneXplorer Supp Figure 1
Raw data are available via the Stanford Microarray Database
Figure 5. Hierarchical clustering of 471 breast carcinomas with 243 solitary fibrous tumor and DTF genes.
Click here for the blue/yellow version of
Treeview GeneXplorer Figure 5.
Click here for the red/green version of
Treeview GeneXplorer Figure 5.
Click here to download the raw data for Figure 5 in a cdt format.
|