Subbaya Subramanian, Robert B. West, Robert J. Marinelli, Torsten O. Nielsen, Brian P. Rubin, John R. Goldblum, Rajiv M. Patel, Shirley Zhu, Kelli Montgomery, Tony L. Ng, Christopher L. Corless, Michael C. Heinrich, and Matt van de Rijn
| Home |
|
Home |
| Figures |
|
Figures and Tables |
| Images |
|
View the EMC tissue array images |
| Data |
|
View the EMC data |
| WebPortal |
|
Stanford Tissue Microarray Consortium Web Portal |
| Authors |
|
Authors |
| Figures | |
|
Figure 1: Unsupervised hierarchical cluster analysis of gene expression profiles of 10 EMCs compared with the expression profiles of 26 different sarcomas including DFSP, GIST, MLS, LMS and SS Each row represents the relative levels of expression for a single gene, centered at the geometric mean of its expression levels across the 36 samples. Each column shows the expression levels for a single sample. The red or green color indicates high or low expression, respectively. A: Overview of expression pattern of the 2,918 genes used for hierarchical cluster analysis. B: The same clustering analysis is shown in more detail for a subset of the genes that are differentially expressed in EMC cases. The genes NMB, LRP5, PHLDA1 and KIT for which we generated ISH probes are highlighted in red. C: Selected genes; note the high levels of expression of APOD, PDGFRB and PDGFB in DFSP and KIT expression in GISTs, consistent with previous studies. KIT expression was surprisingly high in a subset of EMC. | |
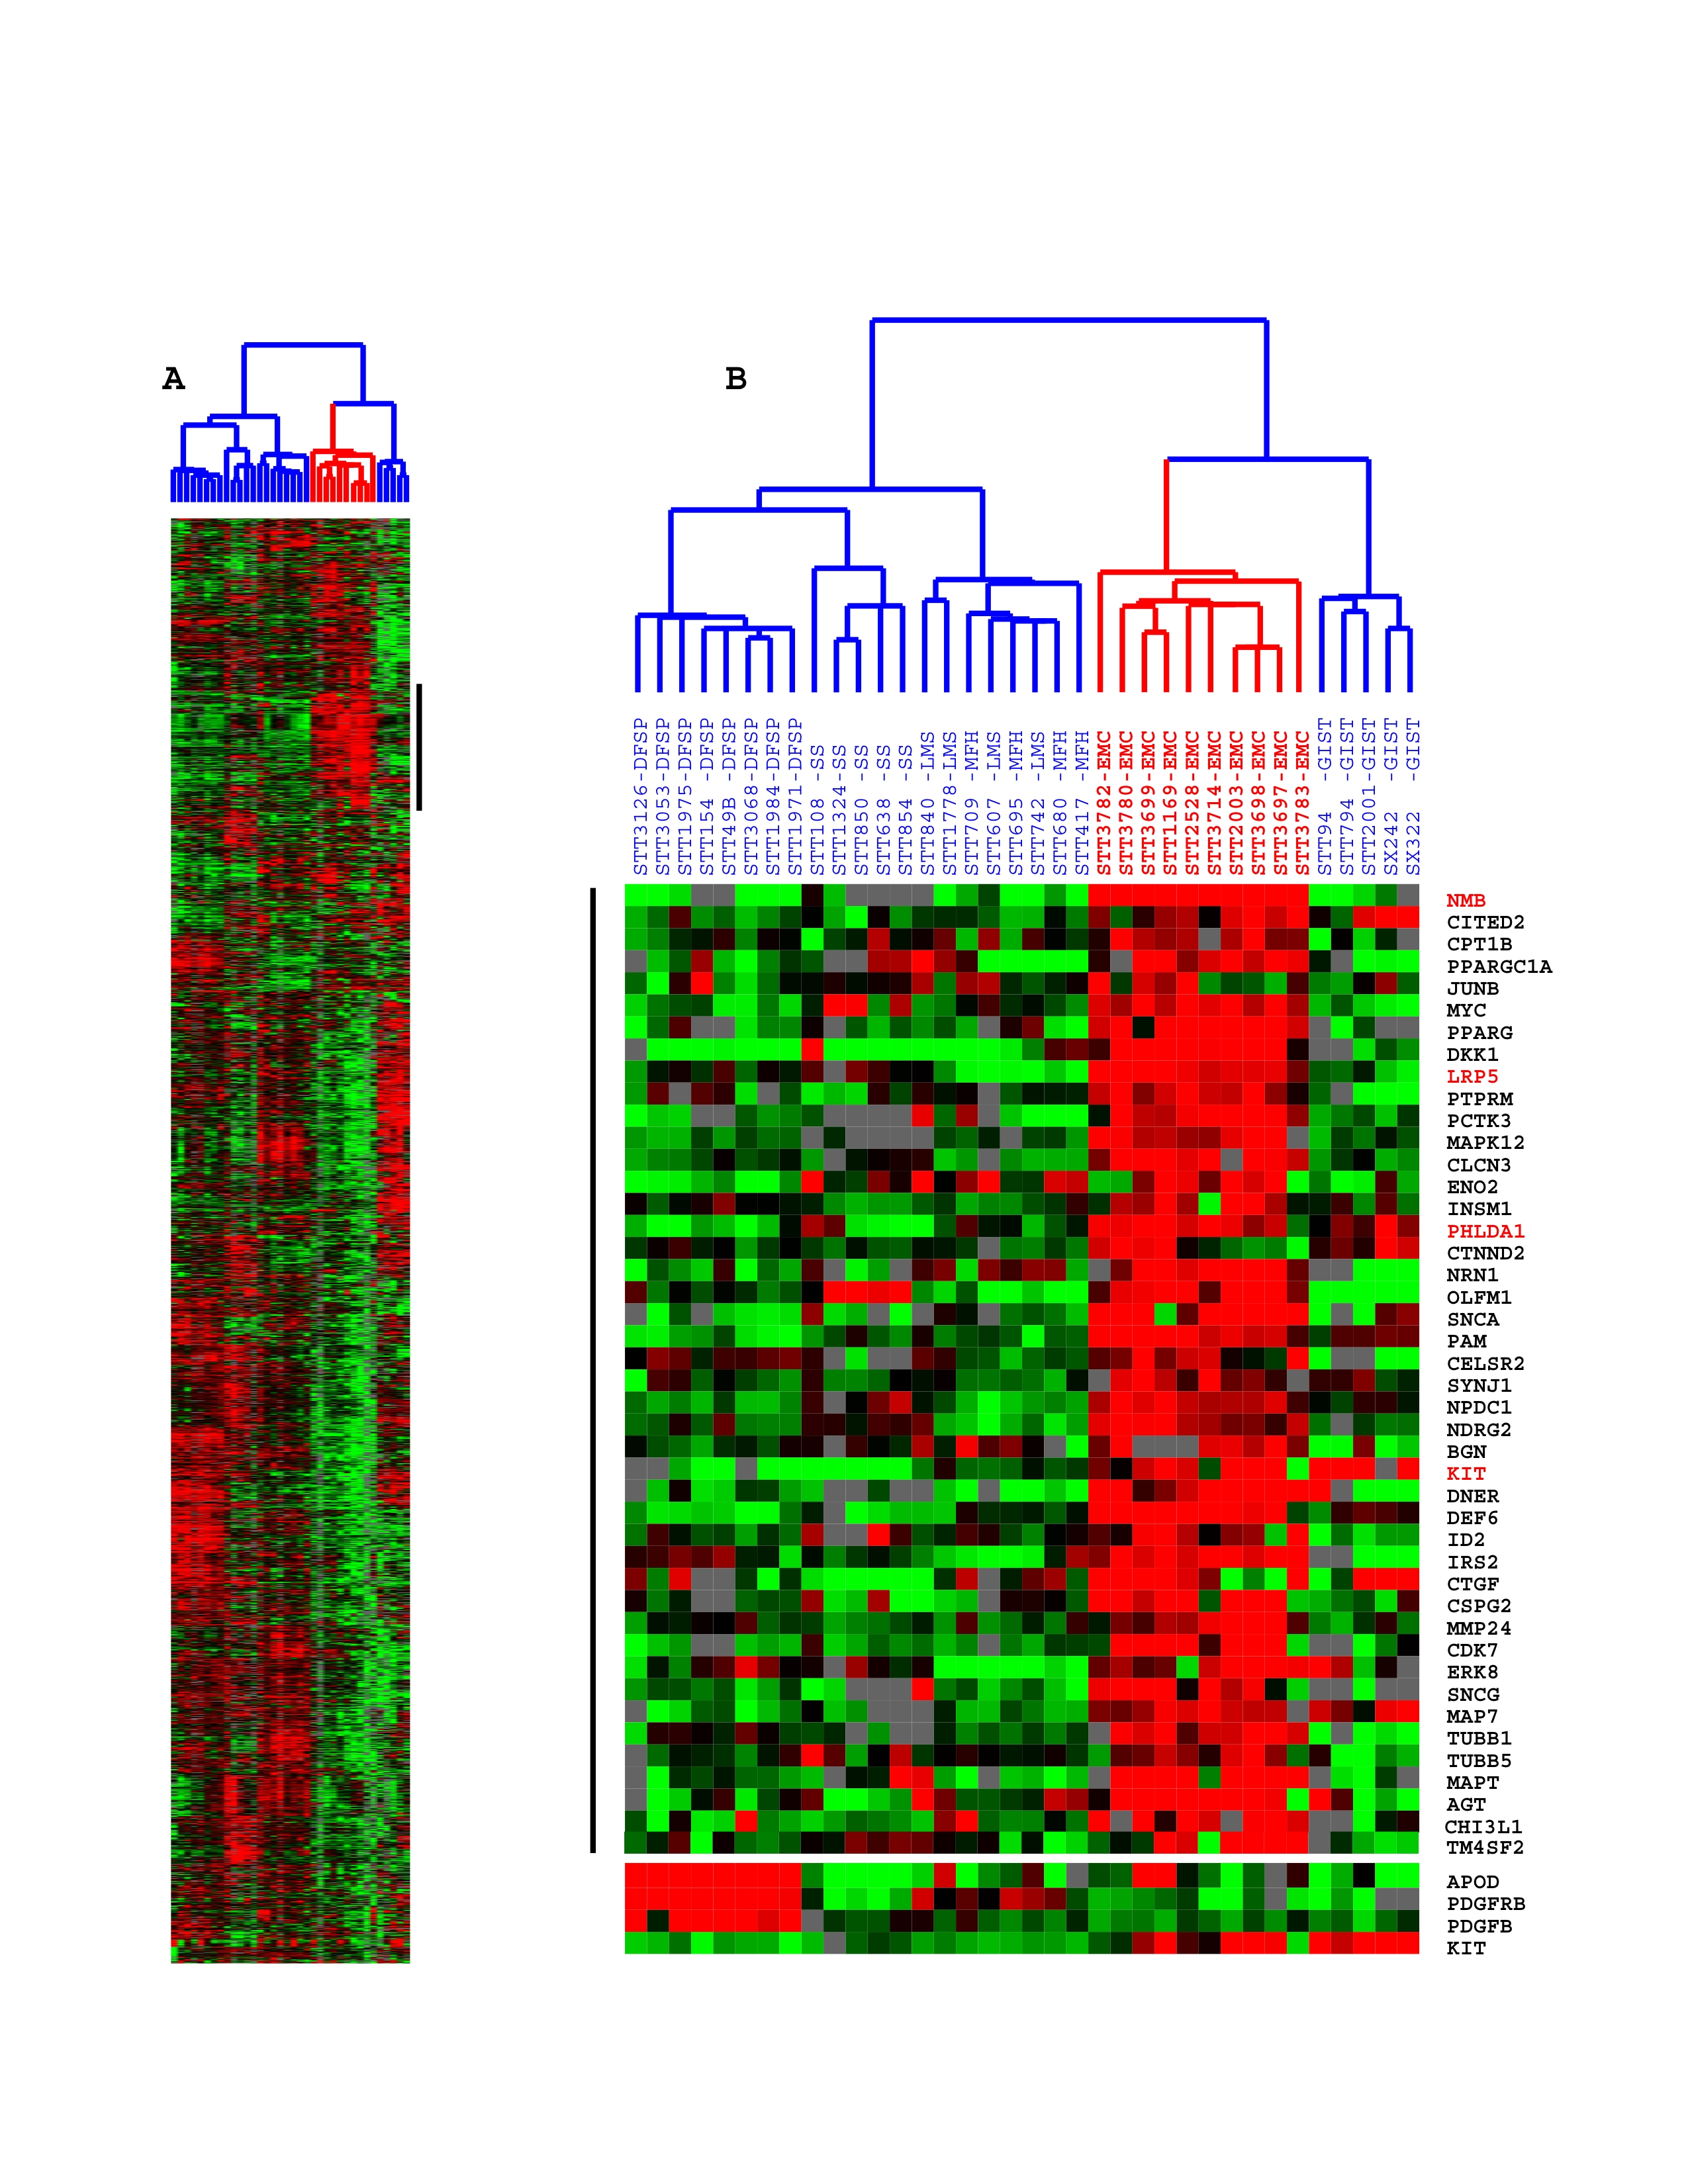
| Available both as a PDF file and a JPEG file |
|
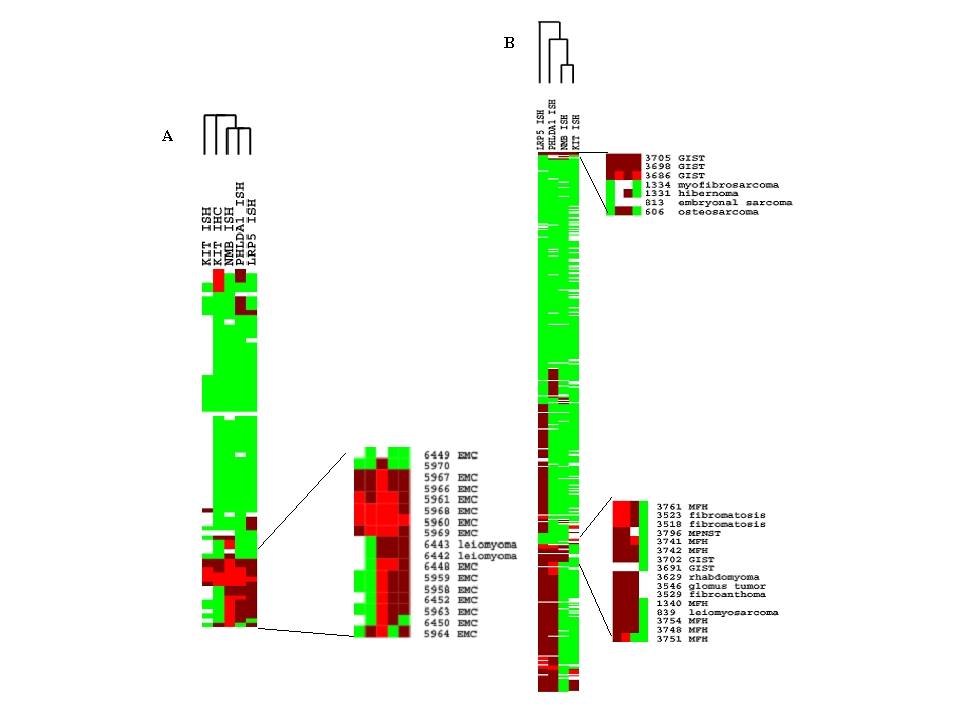
Figure 2: Hierarchical clustering of NMB, LRP5, PHLDA1 and KIT in situ hybridizations of tissue microarrays. Each row represents the staining level for the transcripts tested for a single tumor sample. Each column shows the expression levels for a single transcript tested for different tumor samples. The bright red indicates the strong staining, dull red for weak staining and green for no staining, missing data is left empty. A: Heat map of hierarchical clustering of tissue microarray TA-109 containing mostly EMC and MLS (see GeneExplorer in the accompanying web site). A portion of the heat map is enlarged to show the staining of NMB for the EMC cases included in the array. Note the strong staining of NMB in most cases of the EMC. B: Heat map of hierarchical clustering of tissue microarray TA-38/-39 (see GeneExplorer in the accompanying web site). Note the absence of NMB expression in the majority of sarcomas tested. The enlarged portion shows the few sarcomas that showed weak staining for NMB. Only 1 non-EMC sarcoma, an MFH, showed strong expression for NMB. | |
|
Available both as a PDF file and a JPEG file. |
|
Figure 3: In situ hybridization of EMC with antisense probes to NMB, LRP5, PHLDA1 and KIT. Representative TMA cores of EMC probed for (A) NMB, (B) LRP5, (C) PHLDA1 and (D) KIT. Corresponding negative control sense probes are included in the inset in the top right corner of the EMC cases. The complete data set including the 2,246 digital images is available here | |
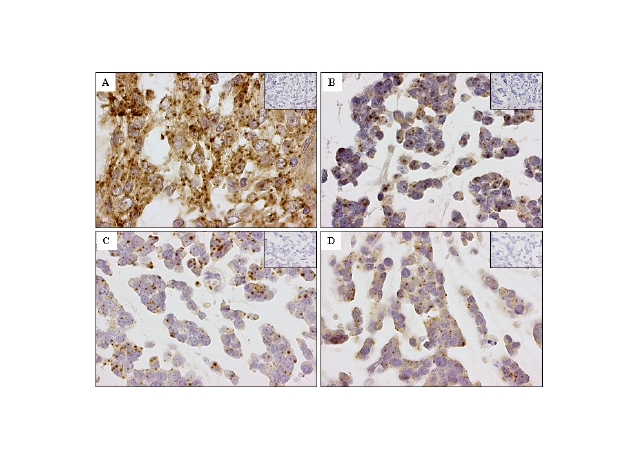
| Available both as a PDF file and a JPG file |
|
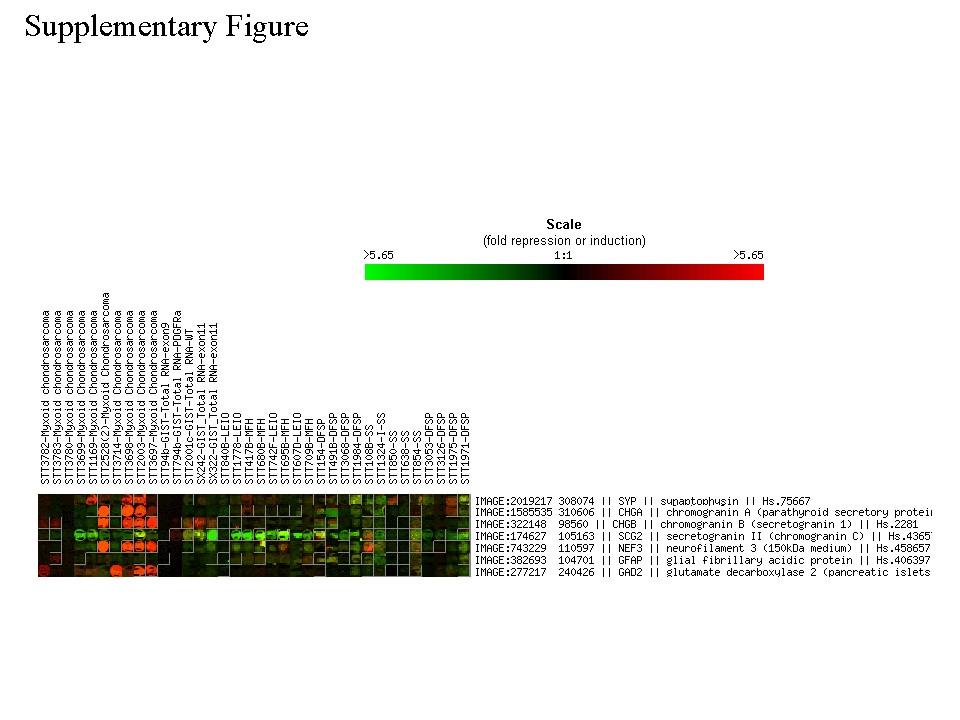
Supplementary Figure 1: Spot images of neural-neuroendocrine marker genes that are not represented in the filtered data. | |
| Available both as a PDF file and a JPG file |
|
Table 1: Clinical data for the 10 cases of EMC tumors used in the gene expression study. | |
| Available to download as table1.xls. |
|
Table 2: First 50 genes with highest differential expression in EMC according to SAM analysis. Input parameters for SAM analysis: imputation engine is 10 nearest neighbor imputer; data type is two class-unpaired data; data are in log scale; number of permutations is 100; RNG seed is 1234567; delta fold changes are 1.86835 and median number of false significant is 0.2205 | |
| Available to download as table2.xls. |
|
Table 3: Staining results for NMB in situ hybridization on TMAs TA-38/-39, TA-109, TA-140 and TA-03/008 in tabular form. Only sarcomas represented by at least 9 different cases on the tissue array are given in this table. The number of positives includes both strong and weak positives. The staining results on sarcoma types for which less than 9 cases were present are shown in Supplementary Table 6. | |
| Available to download as table3.xls. |
|
Supplementary Table 1: Sarcomas represented on tissue microarrays TA-109 and TA-140. This table is available for download as suppletable1.xls. | |
|
Supplementary Table 2: NMB ISH staining for 526 cases representing 15 different carcinomas on tissue microarray (TA-41 and TA-42). A score of 2 represents strong positive, 1 for weak positive and -2 for no staining. This table is available for download as suppletable2.xls. | |
|
Supplementary Table 3: The primer sequences for the NMB, LRP5, PHLDA1 and KIT in situ hybridization probes. This table is available for download as suppletable3.xls. | |
|
Supplementary Table 4: The complete SAM gene list for EMC. This table is available for download as suppletable4.xls. | |
|
Supplementary Table 5: NMB ISH scorings for TMA TA-03/008. A score of 2 represents strong positive, 1 for weak positive and -2 for no staining. This table is available for download as suppletable5.xls. | |
|
Supplementary Table 6: Staining results for NMB in situ hybridization on TMAs TA-38/-39, TA-109, TA-140 and TA-03/008. The number of positives includes both strong and weak positives. This table is available for download as suppletable6.xls. | |