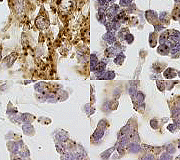
Subbaya Subramanian, Robert B. West, Robert J. Marinelli, Torsten O. Nielsen, Brian P. Rubin, John R. Goldblum, Rajiv M. Patel, Shirley Zhu, Kelli Montgomery, Tony L. Ng, Christopher L. Corless, Michael C. Heinrich, and Matt van de Rijn
| Home |
|
Home |
| Figures |
|
Figures and Tables |
| Images |
|
View the EMC tissue array images |
| Data |
|
View the EMC data |
| WebPortal |
|
Stanford Tissue Microarray Consortium Web Portal |
| Authors |
|
Authors |
| Search & Explore Data |
|
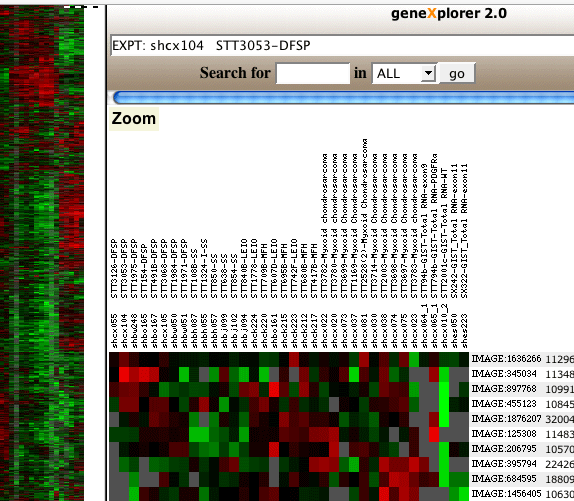
GeneXplorer is a web server application that allows the exploration of large bodies of gene expression data generated by DNA microarray experiments using a Web Browser program as it's interface. The data is displayed in a "Radar" view on the left, and a "Zoom" view on the right. The "Radar" gives an overview of the general patterns observable in the expression data after it has been submitted to a clustering procedure. This clustering process reorders the data by similarity and was recently described by Eisen et al. (1998). By clicking on a region of interest in the "Radar" view, a regional enlargement will be displayed in the "Zoom" view. Here the names of genes are visible, including links to the SOURCE project at Stanford. |
|
| Follow these links to explore details of the figures (opens a new window): | |
|
GeneXplorer Figure 1. Gene expression data. |
 |
|
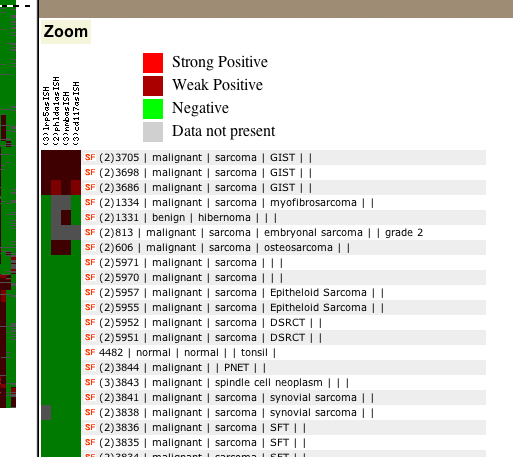
GeneXplorer Figure 2. Tissue microarray |
 |
|
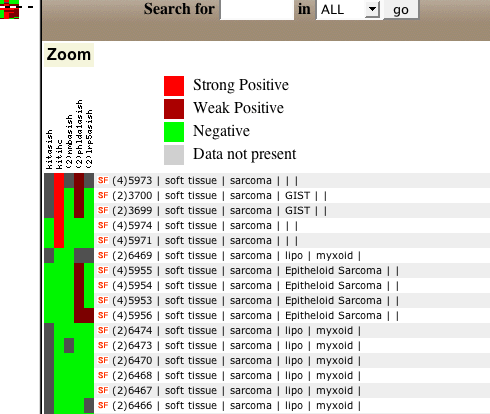
GeneXplorer Figure 3. Tissue microarray |
 |
|
GeneXplorer Supplementary Figure 2. Tissue microarray TA-140 |
 |