CaseXplorer
GeneXplorer is a web application written by
Christian Rees
that allows the exploration of large bodies of gene expression data
generated by DNA microarray experiments using a web browser
as its interface. Gene Explorer is based on the Windows program
TreeView
written by Michael Eisen.
CaseXplorer is a version of GeneXplorer that has been modified by Chih Long Liu to work
with Stainfinder, an on-line program by Wijan Prapong that
retrieves the corresponding spot images from an on-line digital image database.
For more information on GeneXplorer, refer to the publication in BMC Bioinformatics (2004) 5:141. The
PubMed listing is here.
The Apo D Dataset
A hierarchical clustering algorithm (Eisen et al.
(1998)) was used to group genes based on similarity in the pattern with which their expression
varied over all samples. The same clustering method was used here in this dataset to group
tumor samples based on similiarities in their expression of proteins stained by IHC. The data are shown in a matrix format, with each row representing
all the staining results for a single tissue core sample of the array, and
each column representing the measured expression levels for all core samples in a
single antibody stain. To visualize the results, the expression level of each core sample
was represented by a color, with bright red representing a positive staining result, dark red representing a weak positive staining result, green representing a negative staining result, and black representing uninterpretable or missing data.
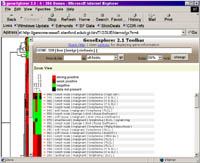 A "bird's eye view" of the data is displayed in a "thumbnail" or
"Radar" pane on the
left, and a blown up view in the "Zoom" pane on the right.
The "Radar" gives an
overview of the general patterns observable in the expression data after it has been submitted to a clustering procedure.
A "bird's eye view" of the data is displayed in a "thumbnail" or
"Radar" pane on the
left, and a blown up view in the "Zoom" pane on the right.
The "Radar" gives an
overview of the general patterns observable in the expression data after it has been submitted to a clustering procedure.
By clicking on a region of interest in the "Radar" view, a regional enlargement will be displayed in the "Zoom" view.
Here an identifier for each tissue core sample is visible. Each row include a link to the Stainfinder program, which retrieves the actual image of the core sample for all antibodies in the dataset used to stain the core sample.
Follow this link to explore details of the on-line Apo D
dataset (opens a new window):
Apo D