John PT Higgins, Gulsah Kaygusuz, Lingli Wang, Kelli Montgomery, Veronica Mason, Shirley X Zhu, Robert J Marinelli, Joseph C Presti Jr, Matt van de Rijn, James D Brooks
| Home |
|
Home |
| Images |
|
View the Bladder tissue array images |
| Figures and Tables |
|
View or download Figures and Tables |
| WebPortal |
|
Stanford Tissue Microarray Consortium Web Portal |
| Authors |
|
Authors |
| Figures and Tables |
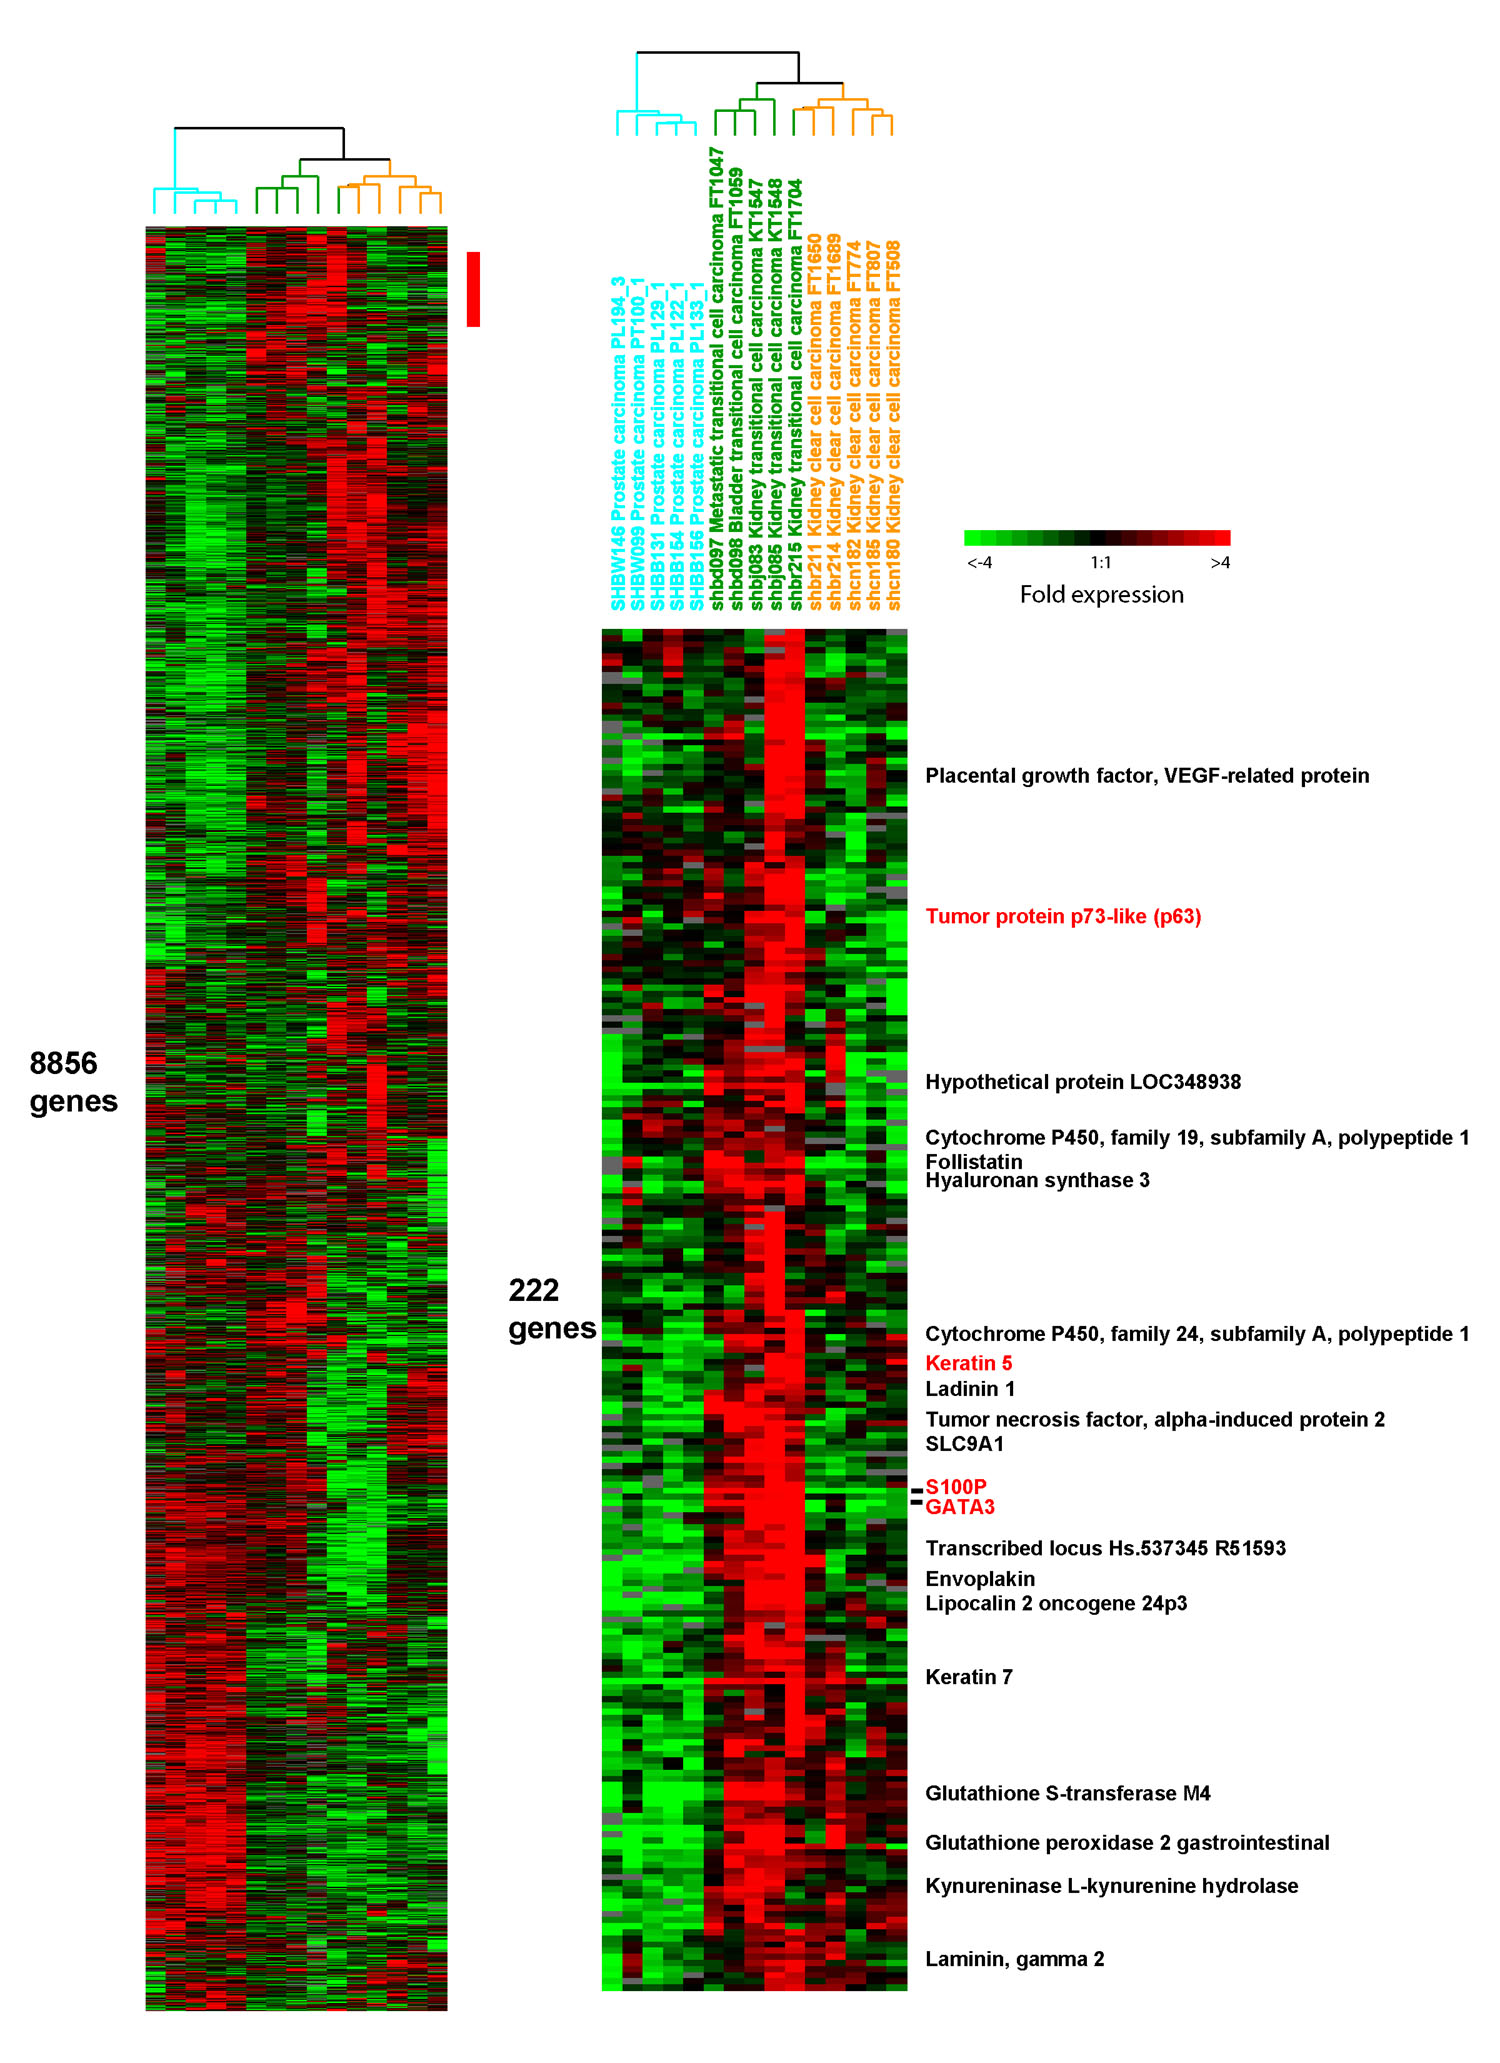
Figure 1: (full size) Genes highly expressed in urothelial carcinoma. The sample dendrogram at the top of the figure reflects the relative degree to which the samples show similar expression of 8856 genes. Each tumor type shows a reproducible pattern of gene expression that causes them to be grouped together in this dendrogram. One urothelial carcinoma is exceptional in that it is grouped with the renal carcinomas. The heatmap below the dendrogram represents 220 genes that are highly expressed in urothelial carcinomas. Selected gene names are provided to the right of the heatmap and their expression profiles across the samples can be read from the heatmap. Genes for which protein expression was investigated by immunohistochemistry include Tumor protein p73-like (p63), Keratin 5, S100P, and GATA3. These genes are highlighted red.
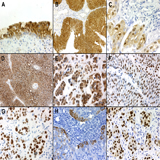
Figure 2: (full size) Immunohistochemistry. A: S0084 expression in normal urothelium. Both cytoplasmic as well as strong nuclear expression is seen. The basal layer is largely unstained. B: S0084 expression in low grade papillary urothelial carcinoma. Strong staining of the entire epithelium for S0084 is seen while the underlying stroma is negative. C: S0084 expression in high grade, invasive urothelial carcinoma. Pleomorphic, highly irregular nuclei are stained while cytoplasmic staining is weaker. D: Monoclonal S100P staining in low grade urothelial carcinoma. The pattern of staining is essentially identical to that seen for S0084 with both cytoplasmic and nuclear staining. E: Monoclonal S100P staining in high grade urothelial carcinoma. F: GATA3 staining in low grade urothelial carcinoma. There is no significant cytoplasmic staining. G: GATA3 staining in high grade, invasive urothelial carcinoma. H: Typical subset staining pattern of low grade urothelial carcinoma for cytokeratin 5/6. Strong staining is limited to those cells located next to the adjacent stroma. I: Typical, strong, specific nuclear staining of high-grade, invasive urothelial carcinoma for p63.
Table 1: Urothelial carcinoma immunohistochemistry
Table 2: S100p expression by immunohistochemistry
Table 3: GATA3 expression by immunohistochemistry
|
||||||||||||||||||||||||||||||||||||||||||||||||||||||||||||||||||||||||||||||||||||||||||||||||||||||||||||||||||||||||||||||||||||||||||||||||||||||||||||||||||||||||||||||||||||||||||||||||||||||||||||||||||||||||||||||||||||||||
