Prognostic significance of macrophage infiltration in leiomyosarcomas
Cheng-Han Lee1, 2 †, Inigo Espinosa1†, SuzanVrijaldenhoven1,
Subbaya Subramanian1,Kelli D Montgomery1, Shirley Zhu1, Robert J Marinelli3, Johannes L Peterse 4, Neal Poulin2, Torsten O. Nielsen2, Rob B. West1,
C. Blake Gilks2, Matt van de Rijn1.
Home
|
Figures and Tables |
View the tissue
array images |
Supplemental data |
| Authors |
Authors
|
| Figures |
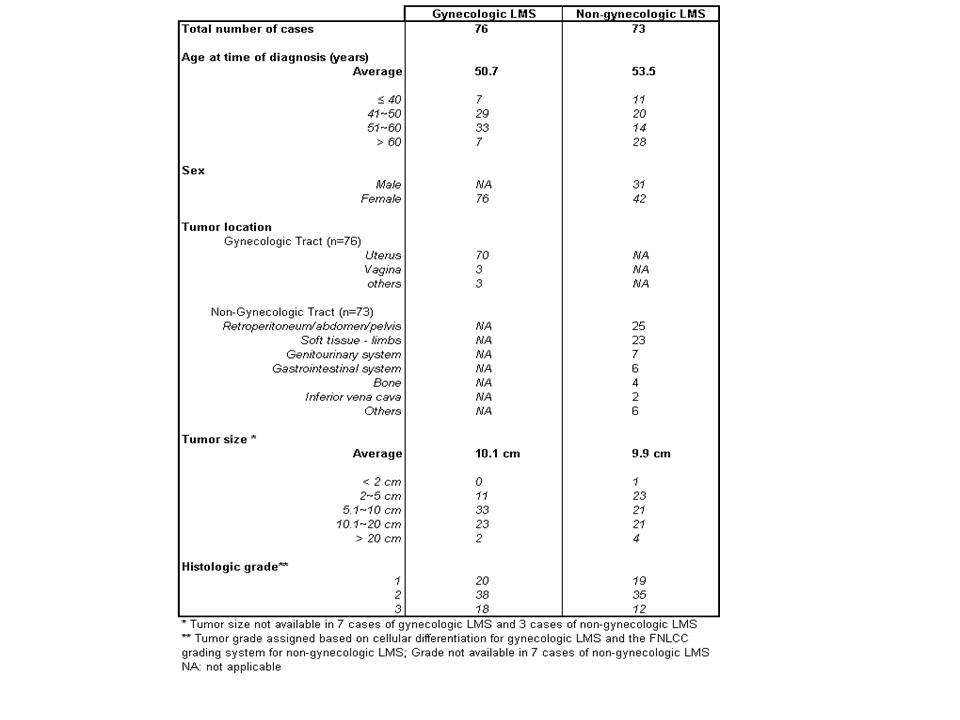
Table 1: Summary of 149 primary LMS used in TMA construction
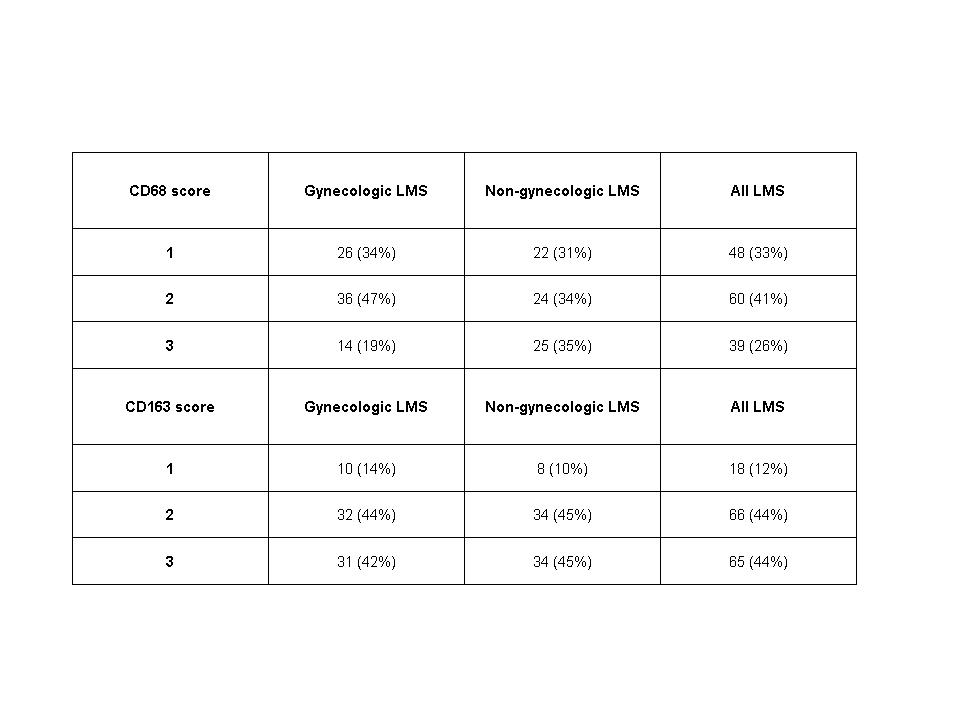
Table 2: Summary of CD163 and CD68 immunohistochemistry results in 149 primary LMS (score 1: sparse infiltrates, score 2: moderate infiltrates, score 3: dense infiltrates).
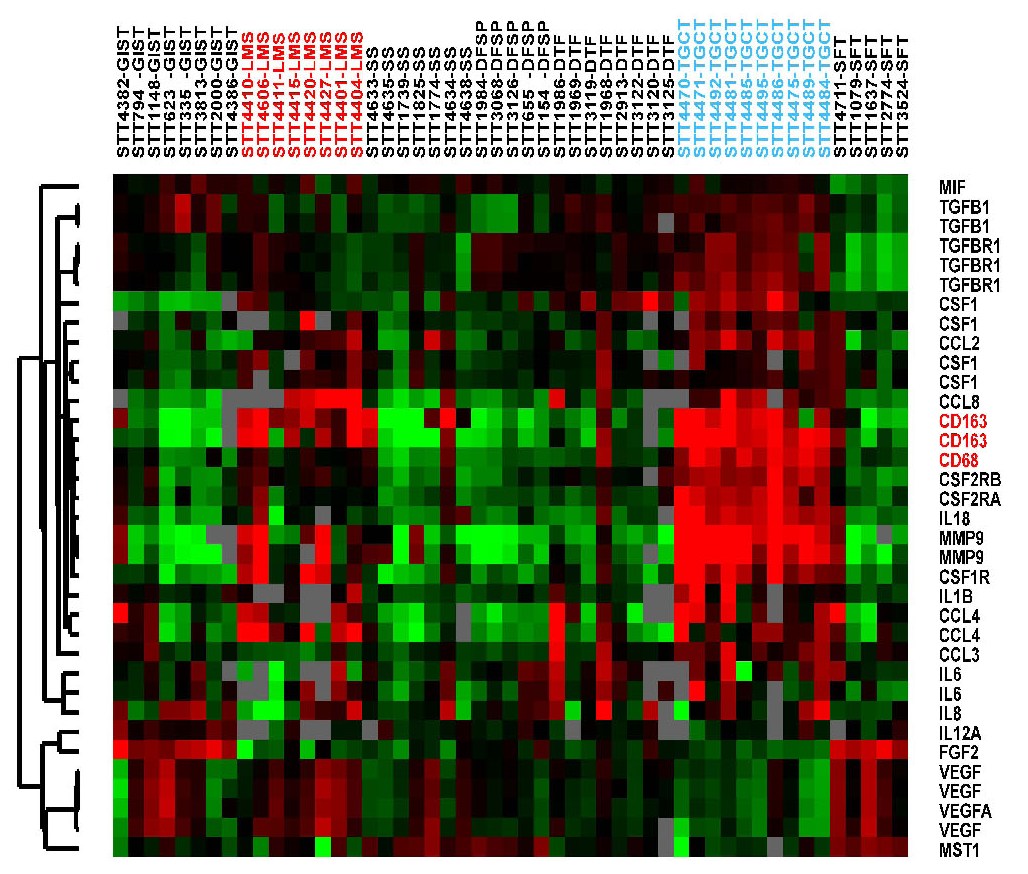
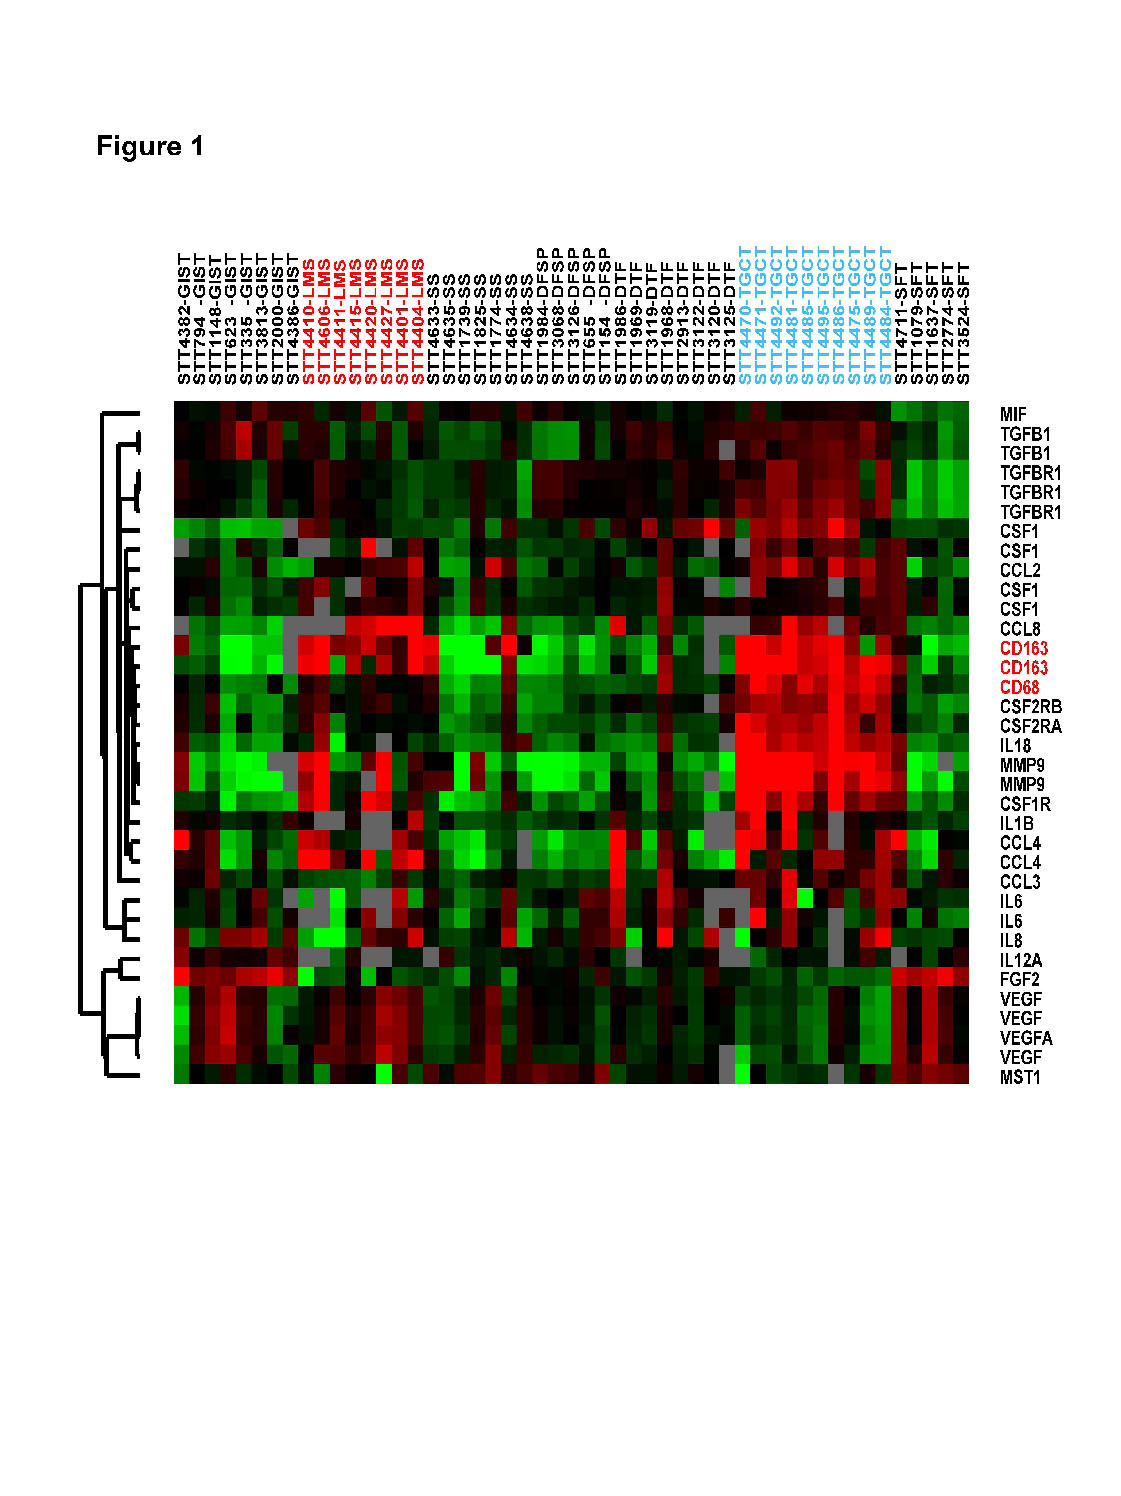
Figure 1: The expression profiles and hierarchical clustering of selected macrophage markers and genes implicated in macrophage-tumor cell interaction. LMS: leiomyosarcomas, GIST: gastrointestinal stromal tumors; DFSP: dermatofibrosarcoma protuberans, DTF: desmoid-type fibromatosis, SFT: solitary fibrous tumorsa, SS: synovial sarcomas, TGCT: tenosynovial giant cell tumors.
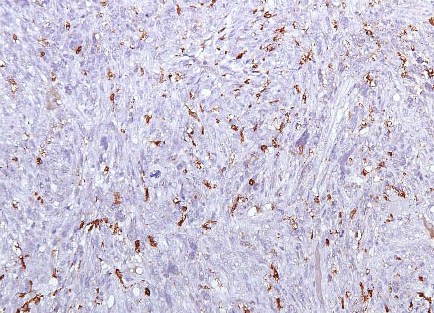
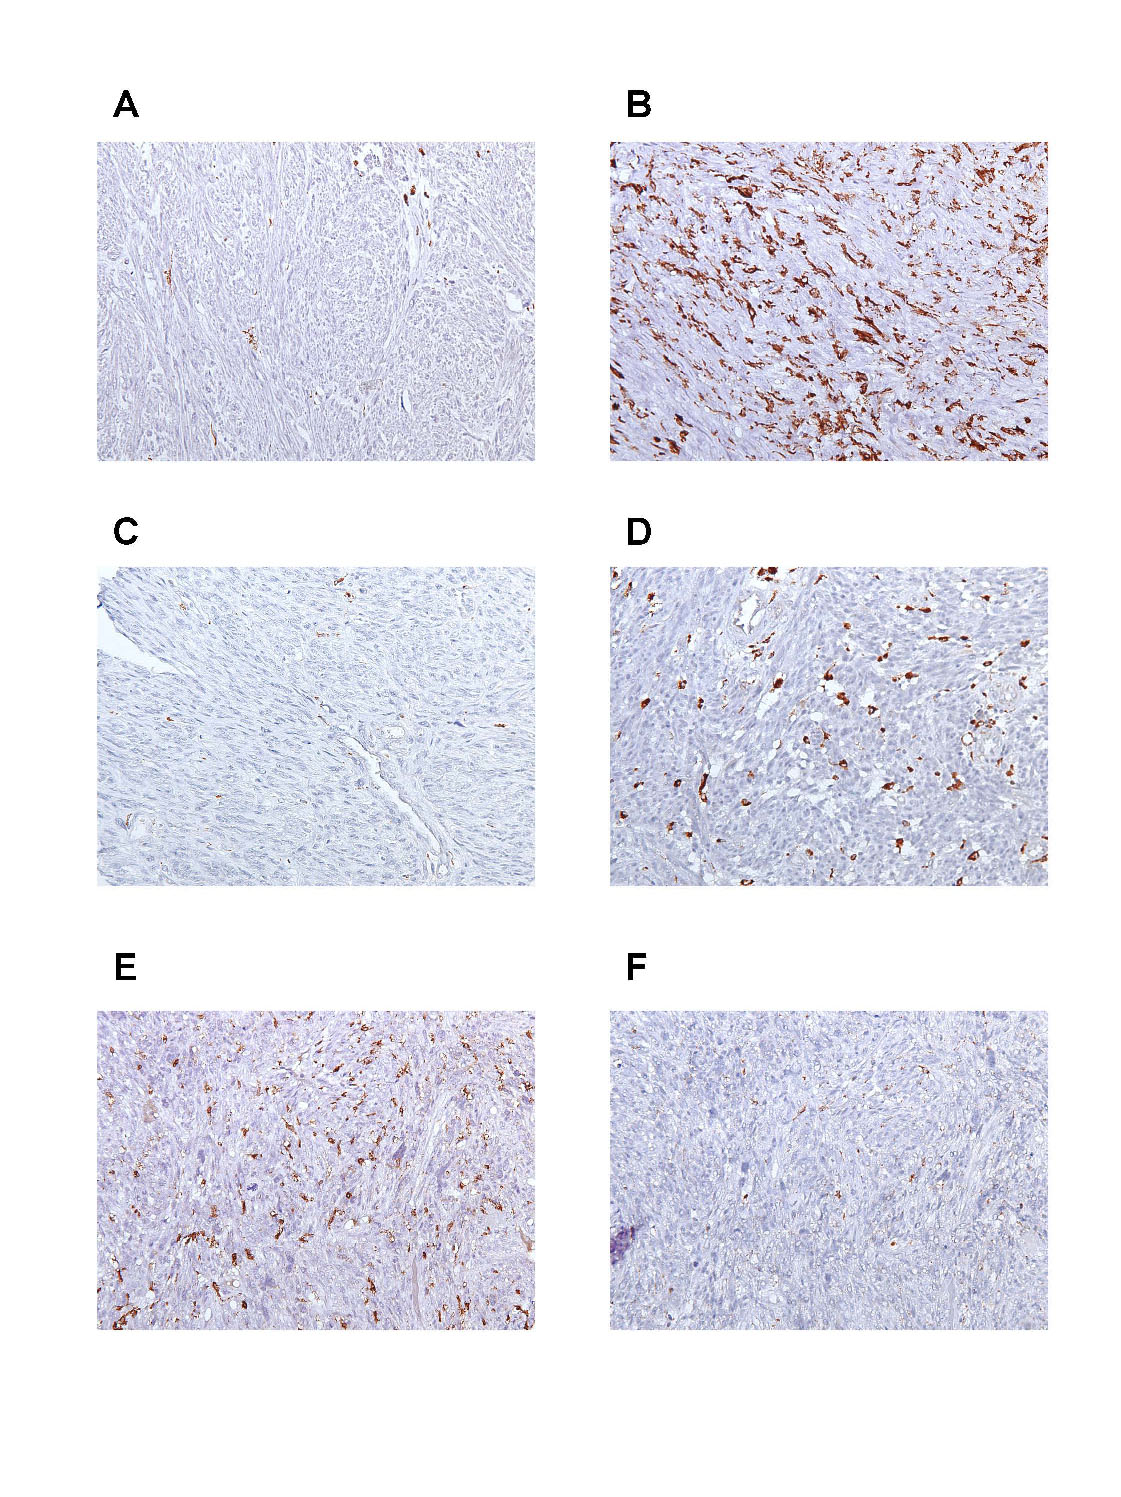
Figure 2: Representative images showing LMS with A) case no.79: sparse infiltrate of CD163 positive macrophages, B) case no.224: dense infiltrate of CD163 positive macrophages, C) Case no.1: sparse infiltrate of CD68 positive macrophages, D) case no.62: dense infiltrate of CD68 positive macrophages, E) case no.161 showing dense infiltration by CD163 positive macrophages but (F) same case no.161 showing sparse infiltration by CD68 positive macrophages.
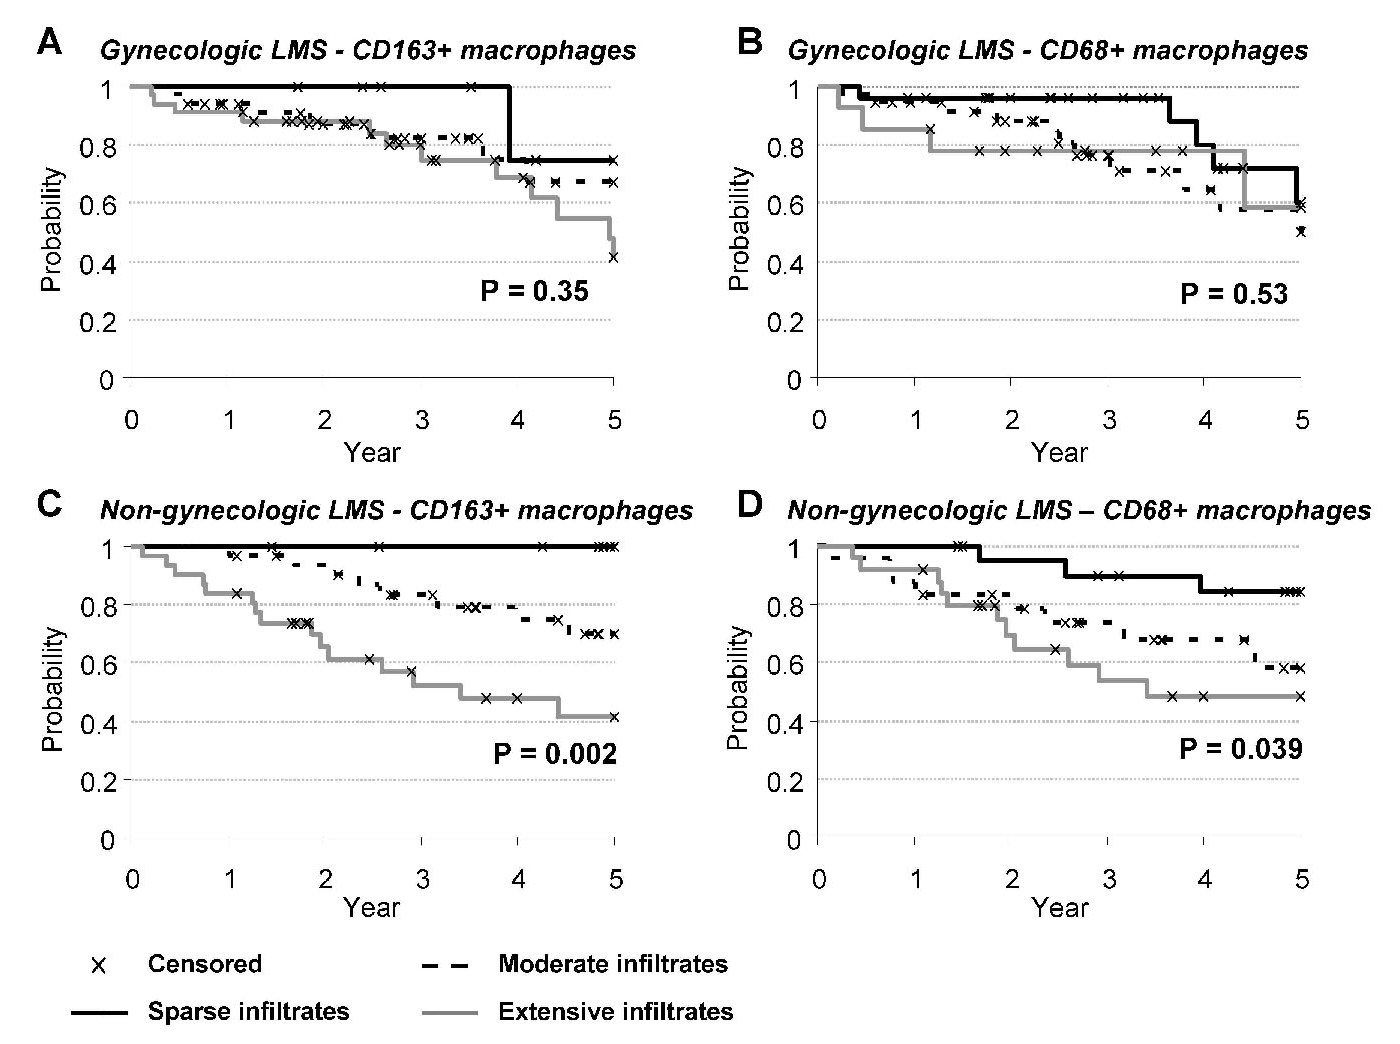
Figure 3: A). Kaplan-Meier survival curves of gynecologic LMS containing varying density of CD163 positive macrophage infiltrates. B). Kaplan-Meier survival curves of gynecologic LMS containing varying density of CD68 positive macrophage infiltrates. C). Kaplan-Meier survival curves of non-gynecologic LMS containing varying density of CD163 positive macrophage infiltrates. D). Kaplan-Meier survival curves of non-gynecologic LMS containing varying density of CD68 positive macrophage infiltrates.
|