Ryan A Metcalf, Shuchun Zhao, Matthew W Anderson, Zhi Shun Lu, Ilana Galperin, Robert J Marinelli, Athena M Cherry, Izidore S Lossos, Yasodha Natkunam
| Home |
| Home |
| Cyclin Images |
| Histological Images |
| Figures |
| Figures |
| WebPortal |
| Stanford Tissue Microarray Consortium Web Portal |
| Authors |
| Authors |
Figures (click on figure to view full size) | |
Figure 1: Cyclin D2 expression in normal hematopoietic tissue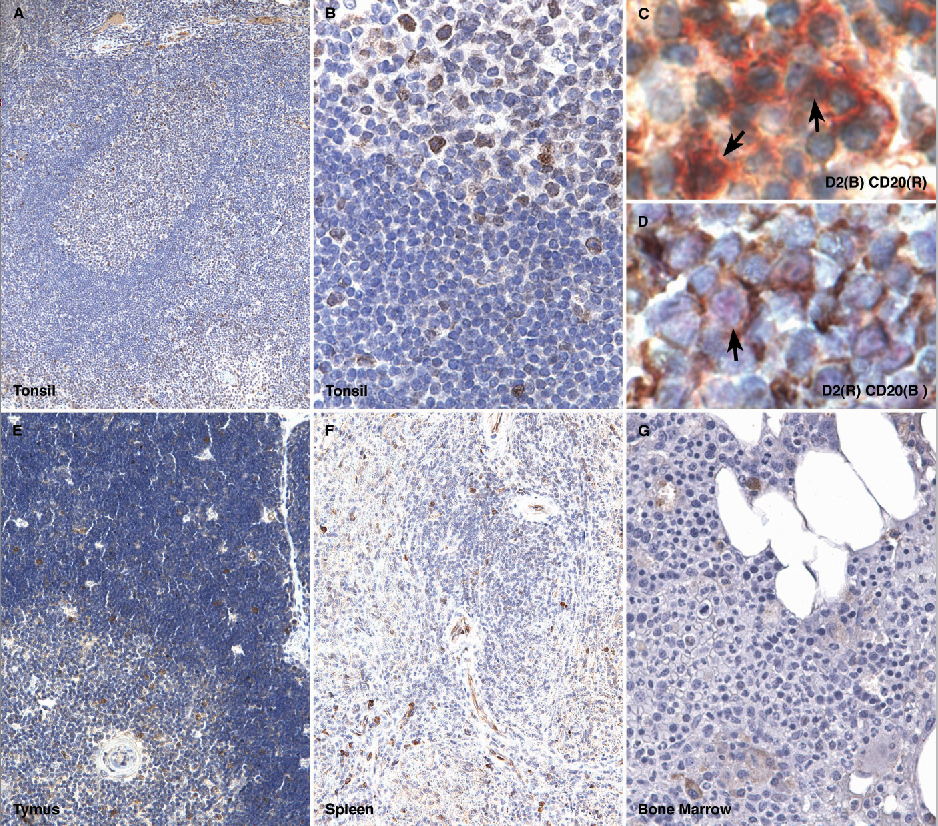 Cyclin D2 staining is found in a subset of cells in the germinal center, mantle and marginal zones and in the paracortex of a normal tonsil (A and B); double immunohistochemical labeling for cyclin D2 (brown) and CD20 (red) show co-localization of staining in a subset of B-cell (arrows, C); double immunohistochemical labeling for cyclin D2 (red) and CD3 (brown) show co-localization of staining in a subset of T-cell (arrow, D); scattered cells in the cortex and medulla of the normal thymus show cyclin D2-positive cells (E); the normal spleen shows staining in scattered lymphoid cells in the red and white pulp and in endothelial cells but is lacking in spenic marginal zones (F); the normal bone marrow shows staining in scattered lymphoid and plasma cells but is not found in a significant proportion of erythroid or myeloid precursors or megakaryocytes (G). Figure 2: Cyclin D2 expression in hematopoietic neoplasia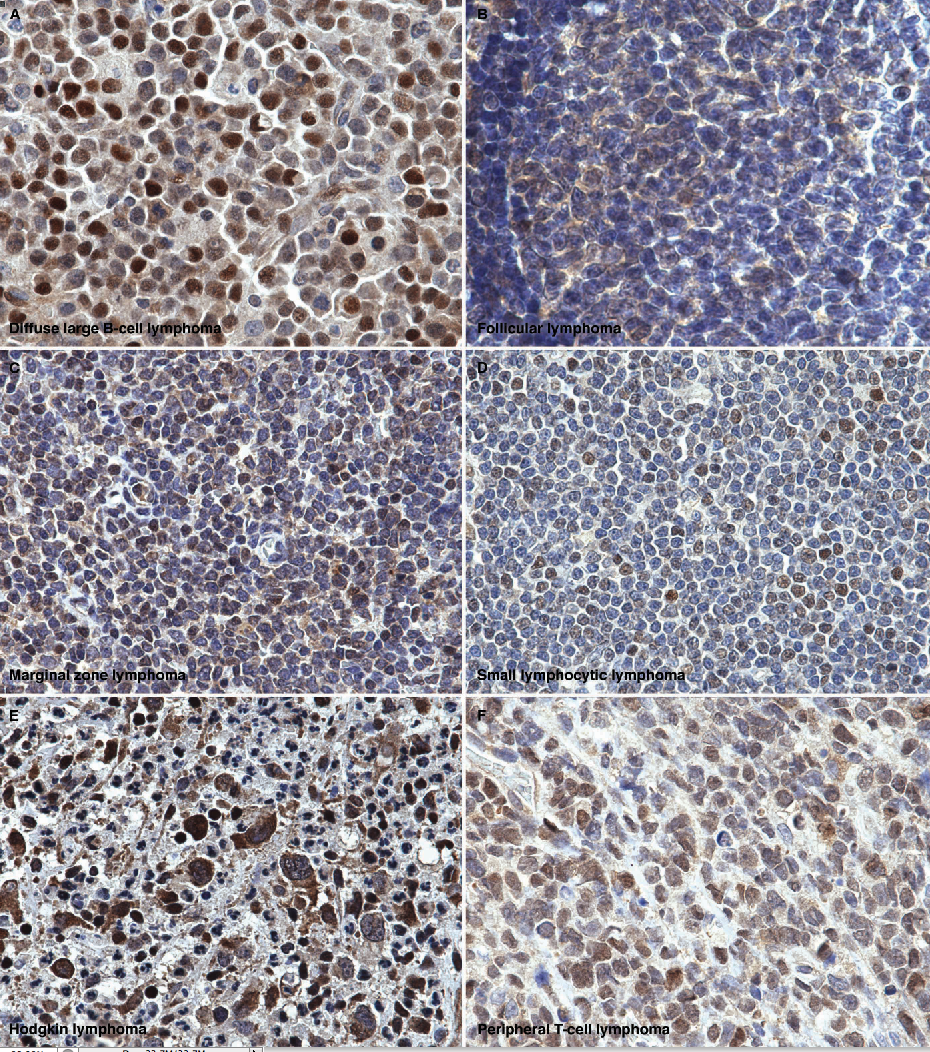 Cyclin D2 staining is shown in examples of diffuse large B-cell lymphoma (A), follicular lymphoma (B), marginal zone lymphoma (C), small lymphocytic lymphoma (D), classical Hodgkin lymphoma (E), and peripheral T-cell lymphoma (F). In all cases, the staining is primarily localized to the nucleus, although associated cytoplasmic staining is also seen in some instances. Figure 3: Cyclin D3 expression in normal hematopoietic tissue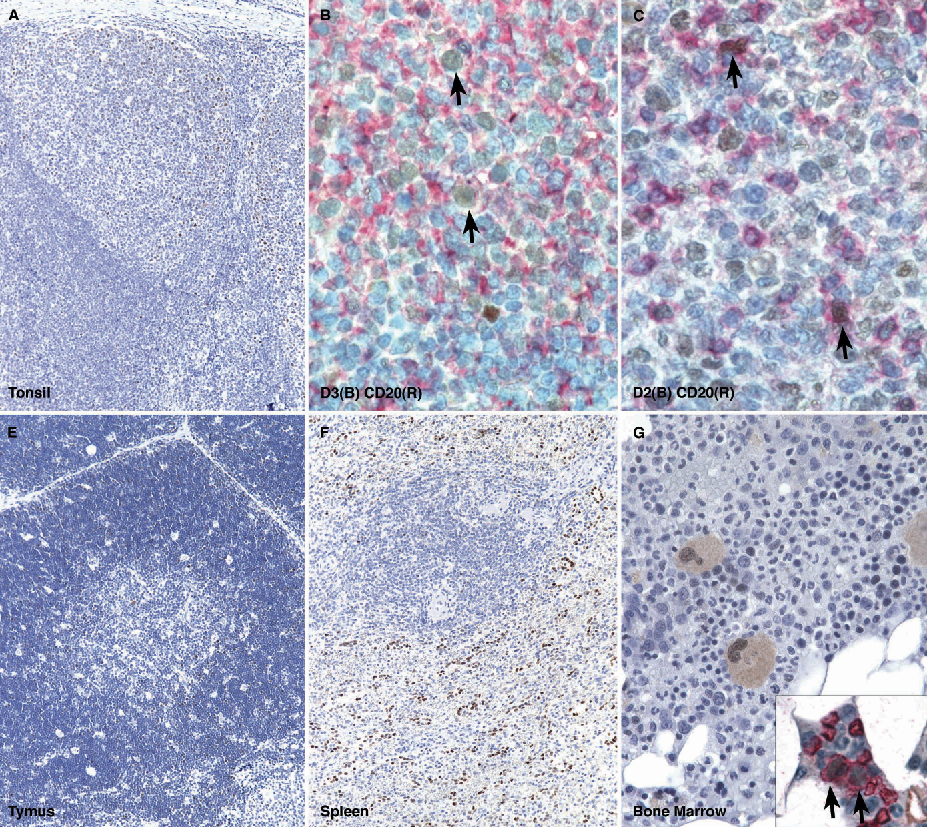 Cyclin D3 staining is found in a subset of cells in the germinal center, and rarely in the mantle and marginal zones and paracortex of a normal tonsil (A); double immunohistochemical labeling for cyclin D3 (brown) and CD20 (red) show co-localization of staining in occasional B-cell (arrows, B); double immunohistochemical labeling for cyclin D3 (red) and CD3 (brown) show co-localization of staining in a subset of T-cell (arrow, C); scattered cells in the cortex and medulla of the normal thymus shows cyclin D3-positive cells (E); the normal spleen shows staining in scattered lymphoid cells in the red and white pulp and in endothelial cells but is lacking in spenic marginal zones (F); the normal bone marrow shows staining in scattered lymphoid and plasma cells, megakaryocytes and in a subset of erythroid precursors (G). Double immunohistochemical labeling of erythroid precursors with glycophorin (red) and cyclin D3 (brown) shows co-localization of the staining in erythroid cells (inset and arrows). Figure 4: Cyclin D3 expression in hematopoietic neoplasia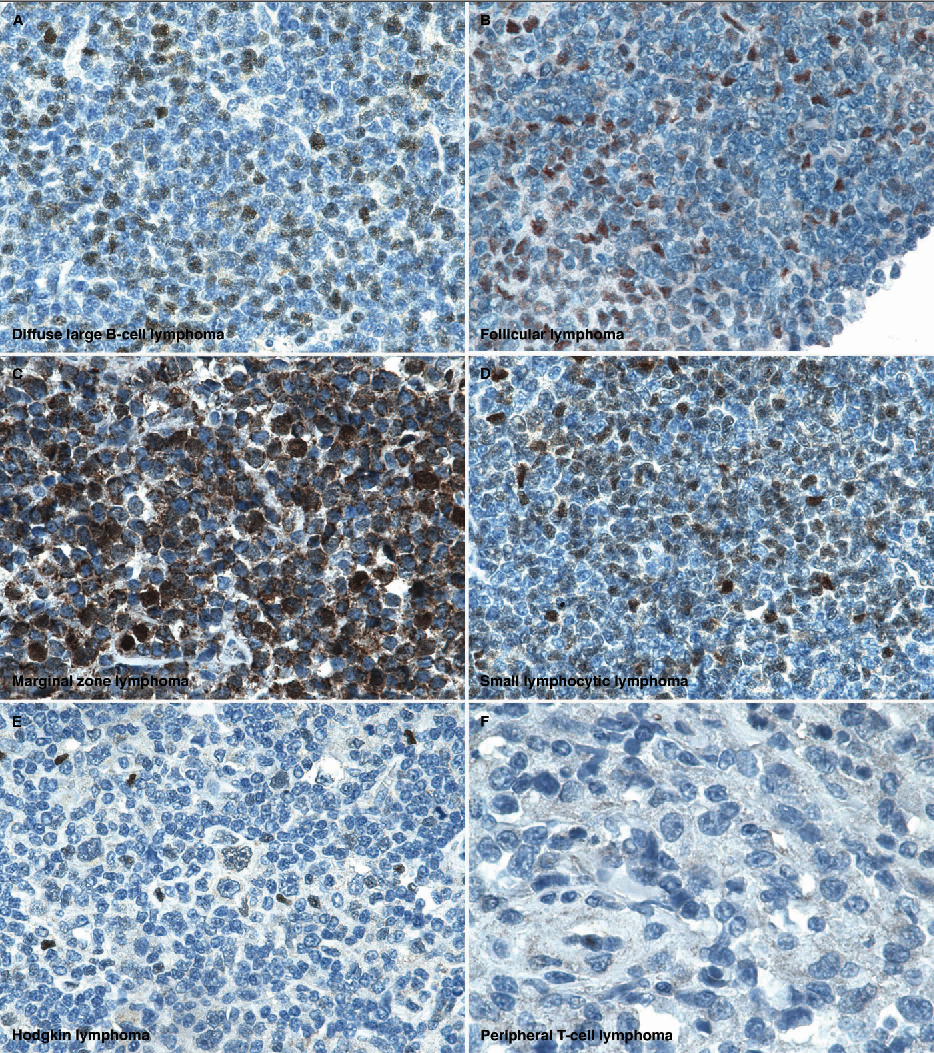 Cyclin D2 staining is shown in examples of diffuse large B-cell lymphoma (A), follicular lymphoma (B), marginal zone lymphoma (C), small lymphocytic lymphoma (D), classical Hodgkin lymphoma (E), and peripheral T-cell lymphoma (F). In all cases, except in the peripheral T-cell lymphoma, the staining is primarily localized to the nucleus, although associated cytoplasmic staining is also seen in some instances. The case of peripheral T-cell lymphoma lacked staining for cyclin D3. Figure 5: The expression of D-cyclins in mantle cell lymphoma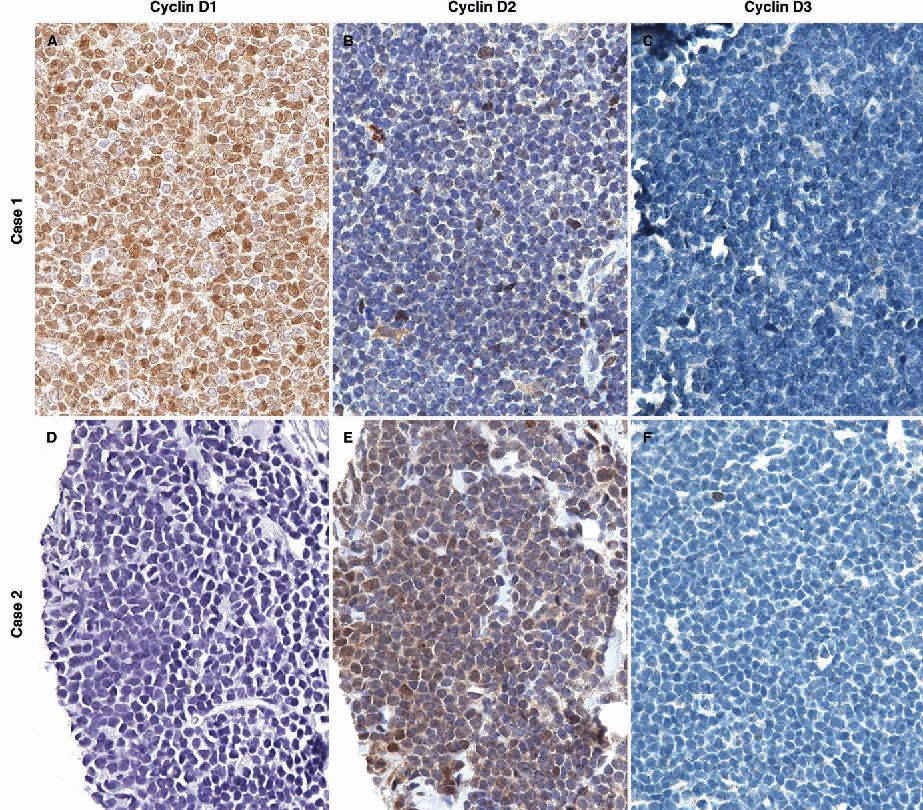 The differential expression of D-cyclin staining in two case examples of mantle cell lymphoma is shown. Case 1 shows intense cyclin D1 and weak cyclin D2 staining. Case 2 shows weak cyclin D1 and strong cyclin D2 staining. Both cases lack staining for cyclin D3. Figure 6: FlSH studies for CCND1/IGH in mantle cell and diffuse large B-cell lymphoma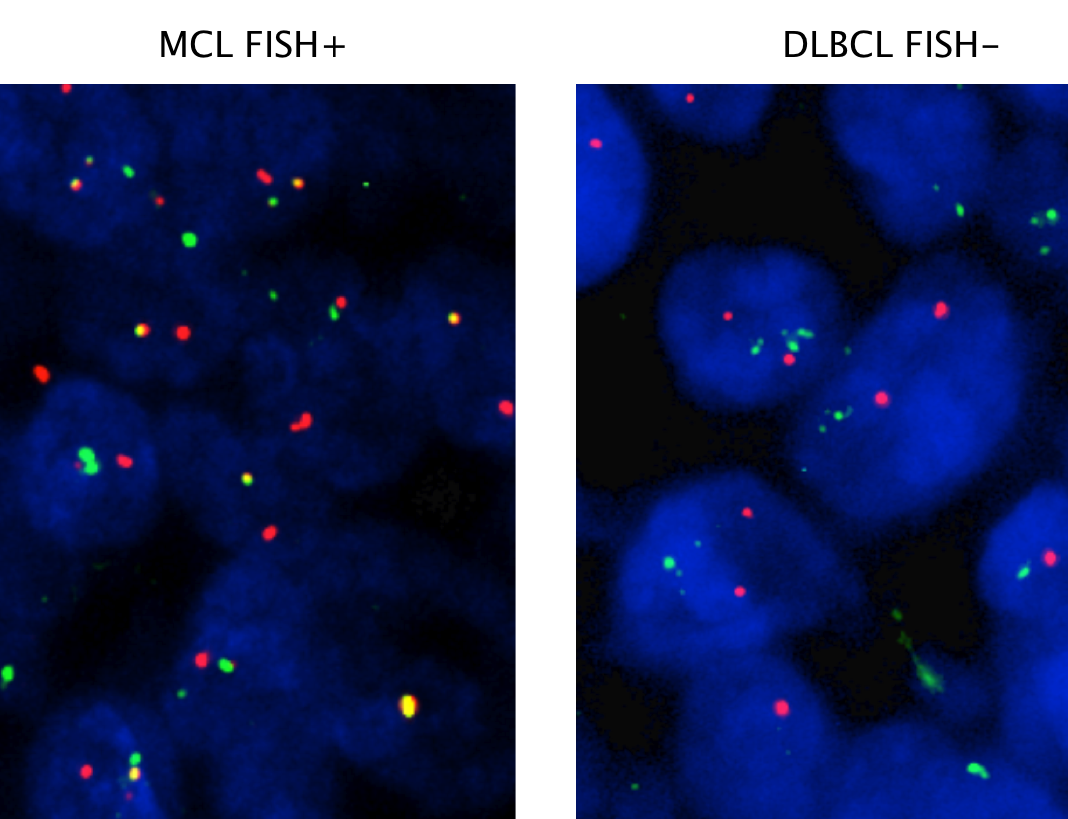 A case example of mantle cell lymphoma shows the dual fusion signal associated with the CCND1/IGH translocation in numerous lymphoma cells (A); an example of cyclin D1-positive diffuse large B-cell lymphoma shows no dual fusion signals within lymphoma cells indicating the lack of the CCND1/IGH translocation (B). Figure 7: Hierarchical cluster analysis of immunohistologic data in diffuse large B-cell lymphoma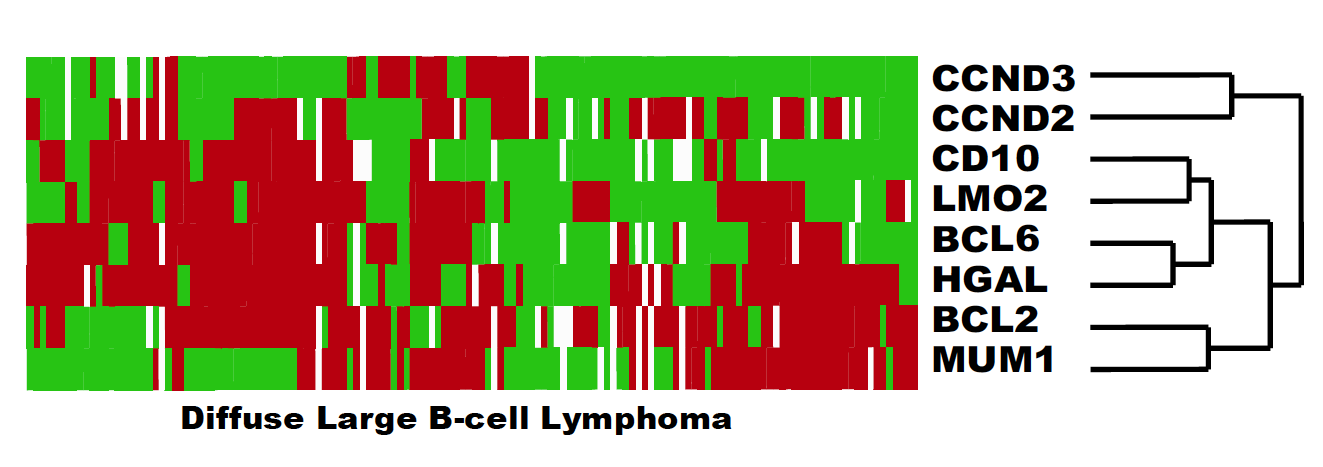 Hierarchical cluster analysis shows that the expression profiles of cyclin D2 and D3 proteins are similar to each other across the 143 cases of DLBCL, but are distinct from that of germinal center-associated markers CD10, BCL6, HGAL and LMO2, and from non-germinal center markers, BCL2 and MUM1/IRF4. |